Food Chain Magnate Score Calculator
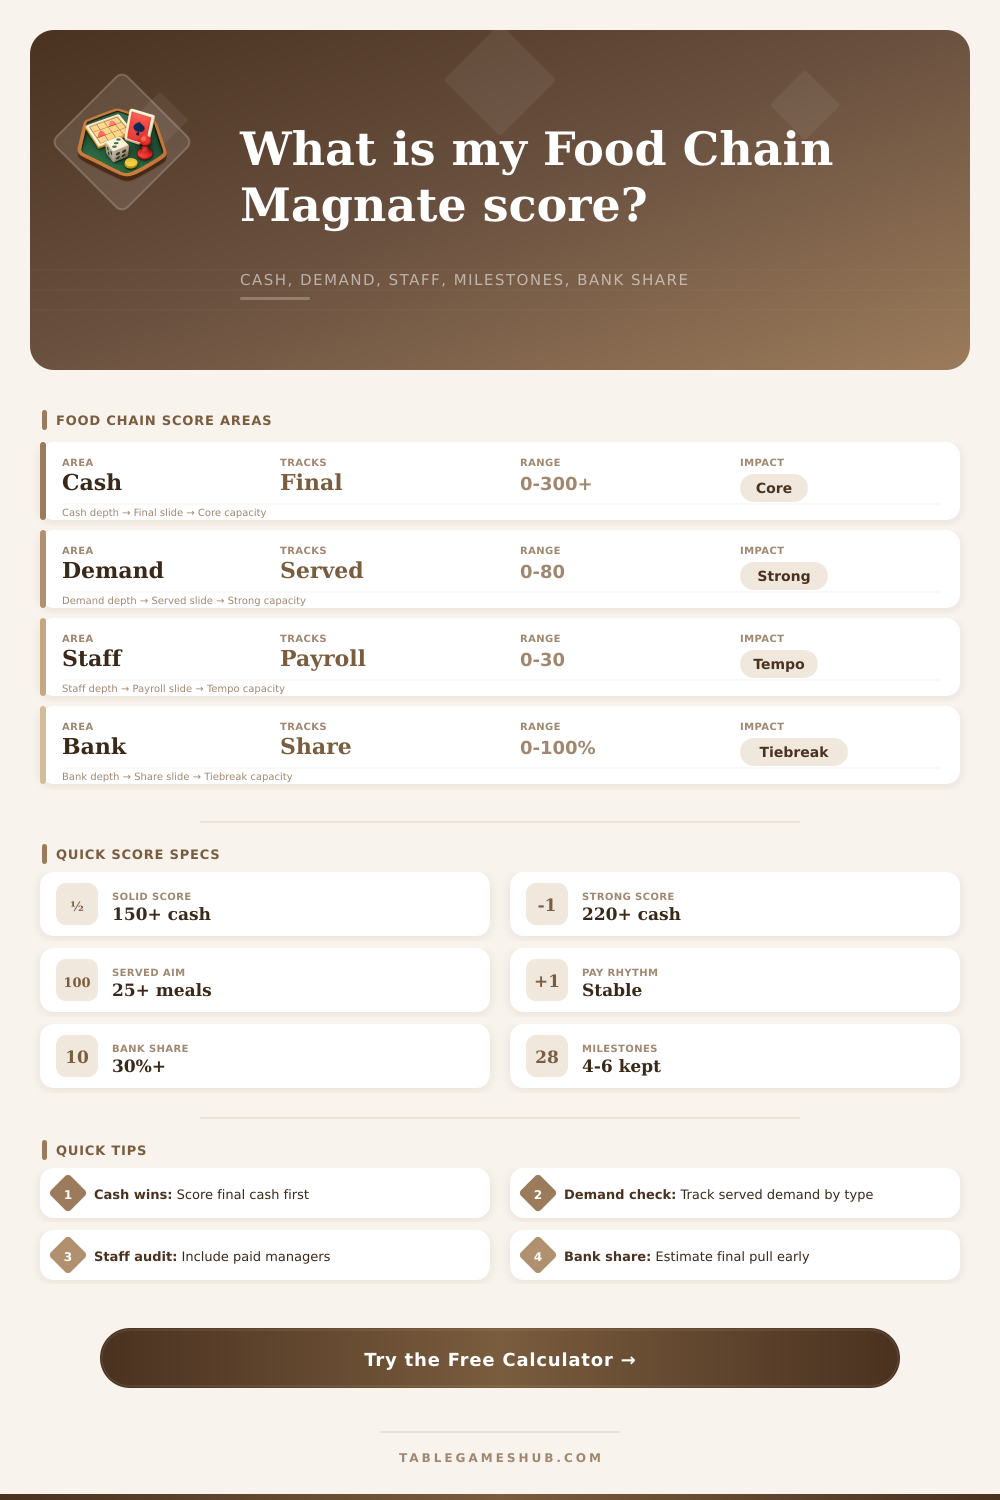
Total final cash, bank-share pressure, demand served, salaries, marketing reach, milestones, and reserve-card strength.
Use this calculator after a Food Chain Magnate session or during a late-game audit. It scores final cash first, then explains how demand, staff structure, milestones, and bank share shaped the finish.
| Score Band | Final Cash | Typical Signal | Audit Note |
|---|---|---|---|
| Learning Finish | Under 100 | Demand missed or late staff drag | Check salary load and idle marketing. |
| Competitive Finish | 100 to 180 | Working engine with uneven conversion | Review product mix against generated demand. |
| Strong Finish | 181 to 260 | Consistent demand served across rounds | Bank share likely mattered. |
| Dominant Finish | 261+ | High conversion and clean final round | Milestones and reserve cards probably aligned. |
| Demand Type | Category | Calculator Input | Score Use |
|---|---|---|---|
| Burgers | Food | Food Orders Served | Product balance and demand conversion. |
| Pizza | Food | Food Orders Served | Product balance and route pressure. |
| Lemonade | Drink | Drink Orders Served | Drink reach and campaign return. |
| Soda or Beer | Drink | Drink Orders Served | Drink reach and route timing. |
| Milestone Area | What It Changes | Calculator Role | Late-Game Signal |
|---|---|---|---|
| Recruiting | Staff tempo | Milestones Held | Faster engine assembly. |
| Training | Staff quality | Milestones Held | Better role density. |
| Marketing | Demand control | Marketing Reach | More reliable final demand. |
| Production | Menu output | Food and Drink Mix | Less unserved demand. |
| Engine Type | Best Input | Risk Flag | Healthy Read |
|---|---|---|---|
| Burger Chain | Food mix | One-demand tunnel | Food share above 55%. |
| Drink Chain | Drink mix | Campaign overreach | Drink share above 40%. |
| Marketing Engine | Reach | Demand not served | Served demand near reach. |
| Staff Engine | Salary load | Cash drag | Served-to-salary above 1.3. |
| Mode | Players | Score Focus | Best Audit Metric |
|---|---|---|---|
| Tight Duel | 2 | Route denial and final cash | Bank share above 45%. |
| Classic Table | 3 | Demand creation and conversion | Served demand above 25. |
| Crowded Market | 4 | Turn order and milestone spread | Milestones held above 3. |
| Full Table | 5 | Marketing reach and route timing | Reach served above 70%. |
The final cash total is the most important number within the game of Food Chain Magnate. However, the final cash total dont provide a complete explanation of how the player achieved that final cash total. For instance, a player could have gained a high amount of final cash through effective use of reserve cards and milestone.
Alternatively, the player may have used effective use of there demand to convert it into cash. Because there are different methods of achieving the same final cash total, the player must use a score calculator to determine the reasons for the players final cash total. The score calculator takes the various data points from the game and converts those data points into a clear picture of the player’s performance.
How the Score Calculator Explains Your Final Cash
To create the score calculator, a player must input several variable into the score calculator. The restaurant must enter the demand that was served into the score calculator. Additionally, the player must enter the salary load for the restaurant into the score calculator.
Each of these variables is important to determine the efficiency of the restaurant. Furthermore, the food order and the drink orders must be entered separately into the score calculator. These two numbers has different values in the game, thus must be entered separately.
Finally, the bank share for the restaurant must be entered into the score calculator. This value impact the amount of cash that each player receives during the game. The score calculator output variables that indicate the efficiency of the restaurant.
For instance, one of the output variables calculates the demand per salary for the player. Another of the output variables calculates the reach that the marketing department served for the restaurant. Each of these values indicate whether the restaurant made efficient use of their staff, their marketing department, and their player.
For instance, if the demand per salary for the restaurant is high, then the staff for the restaurant are efficient. However, if the demand per salary for the restaurant is low, then the staff for that restaurant is inefficient. Many players enters into the game with mistakes with their knowledge of the game.
Many players focus on the final cash total and ignore the other statistics that determine how that final cash total was reached. For instance, one player may have achieved their final cash total by using their demand very efficient to gain their cash. Another player may have used a single milestone and reserve card to set up their final cash total.
These different paths can be separated by the score calculator. The reference tables included with the score calculator help to show the interpretation of these score. The reference tables indicate the typical score bands for each of the variable in the score calculator.
Common mistakes include focusing on the value of the marketing department without ensuring that the restaurant successfully served the demand. Additionally, another common mistake by player is treating the salary load as a cost rather than the purchase of efficient kitchen staff for the restaurant. Finally, a third common mistake is forgetting that the bank share can act as a tiebreaker for each player in the game.
The score calculator can identify these mistakes. However, no score calculator can replace the player keeping track of the demand by type of food that is sold in the game. Food Chain Magnate is a game that reward the construction of an engine that efficiently converts opportunities to cash without any waste.
The score calculator will reveal which part of a player’s restaurant engine successfully perform such a function, and which parts of that engine did not.