Curling Shooting Percentage Calculator
Compare made shots, attempts, shot value, draw and takeout splits, weighted shooting percentage, and player or team edge.
| Side | Overall % | Draw % | Takeout % | Weighted % |
|---|---|---|---|---|
| Player A | 75.0% | 71.4% | 80.0% | 75.3% |
| Player B | 66.7% | 64.3% | 70.0% | 66.7% |
| Range | Typical label | What it usually means | Best use |
|---|---|---|---|
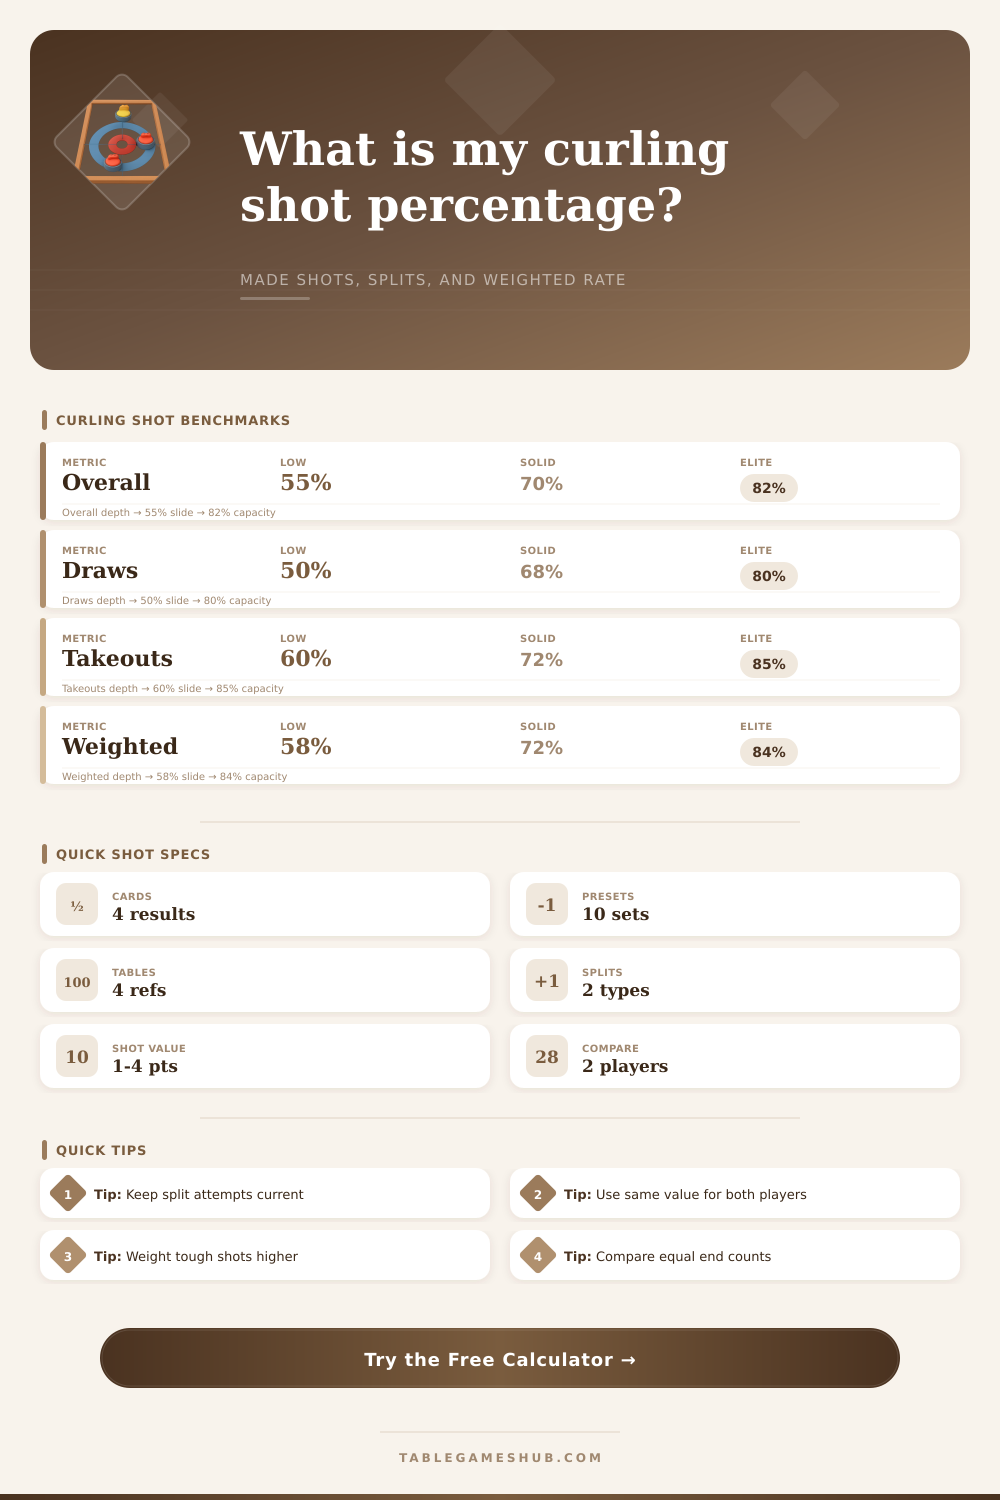
| 85% and up | Elite | Very strong execution across the shot mix | Compare high-level players or short pressure sets |
| 75% to 84% | Strong | Clean made-shot pace with limited misses | League tracking and bonspiel review |
| 65% to 74% | Solid | Playable rate with room in one split | Club games, practice goals, lineup notes |
| 50% to 64% | Developing | Useful sample, but misses are shaping ends | Practice focus and role matching |
| Under 50% | Low | Sample may be hard, noisy, or off pace | Check shot mix and small sample size |
| Shot family | Suggested weight | Example shots | Why it changes the result |
|---|---|---|---|
| Open takeout | 0.8 to 1.0 | Hit, clear, peel | Often easier to repeat than buried placement |
| Guard or draw | 1.0 to 1.2 | Guard, draw, tap | Line and weight both affect success |
| Freeze or come-around | 1.2 to 1.5 | Freeze, bury, curl around | Precision shots can deserve more weight |
| High leverage skip shot | 1.3 to 1.8 | Final draw, double, runback | Raises the impact of pressure attempts |
| Preset | Shot mix | Attempts | Use case |
|---|---|---|---|
| Club Lead | More draws | 24 each | Track guard and draw setup shots |
| League Second | Balanced | 24 each | Compare a mixed draw and hit workload |
| Skip Pressure | High value | 16 each | Review end-deciding shot quality |
| Takeout Heavy | More hits | 24 each | Separate takeout efficiency from draws |
| Practice Set | Custom reps | 40 each | Measure training performance by shot type |
| Output | Formula | Rounding | Notes |
|---|---|---|---|
| Overall % | Made / attempted x 100 | 1 decimal | Uses total made and attempted shots |
| Draw % | Draw made / draw attempts x 100 | 1 decimal | Reports zero when no draw attempts exist |
| Takeout % | Takeout made / takeout attempts x 100 | 1 decimal | Reports zero when no takeout attempts exist |
| Weighted % | Weighted makes / weighted attempts x 100 | 1 decimal | Applies draw and takeout difficulty weights |
| Shot value | Made shots x point value | 1 decimal | Useful for custom scoring sheets |
Curling shot percentages provides information about the performance of a player or a team on the ice. However, shot percentages are only as accurate as the metrics used to calculate that percentage. Using the ratio of the number of shots made to the number of shots attempted by a player or a team is a starting point for measuring performance.
However, this measurement of performance is based on a surface level analysis of a players performance. This measurement of performance dont account for the number of easy shots that a player misses. Additionally, this measurement of performance does not account for the number of difficult shots that a player misses.
Keep draw and takeout percentages separate
Using the percentage as a performance indicator does not account for the difference in draw shots and takeout shots. A player can find the true performance of a player by calculating the percentage of draw shots and takeout shots made by a player. Draw shots and takeout shots requires different skills for success.
The skills required to execute a successful takeout shot is different than the skills required to execute a successful draw shot or a successful freeze. A player may have a high percentage of shots made but a low percentage of draw shots made. This player may struggle with making draw shots in the later ends of the game because the later ends of the game have precise placement requirement for the stones.
Additionally, a player may have a high percentage of takeout shots made but a low percentage of draw shots made. This player may struggle with placing their guards or rocks in the positions that will score the most point for the team. Draw shot percentages and takeout percentages should be calculated separately for each player.
The separate calculations will reveal the areas in which each player need to improve there performance on the ice. Draw shots and takeout shots have different importance in the game of curling. Some shots are more important than others.
For instance, takeout shots in the last end of the game are more important than takeout shots in the third end of the game. This makes the importance of the double takeout in the last end carry more weight in the calculations of the percentage of takeout shots made by a player. Similarly, a simple guard that is made is less important than a comearound freeze that is made.
Come-around freeze take-up is more difficult than a simple guard as the player must get there stone to nestle up against the stones of the opposing players. By weighting the importance of draw and takeout shots, the calculations of the percentage of each type of shot made by a player will account for the pressure that the player felt when making those shots. These types of calculations can be used to compare the performance of two players or two teams.
However, care should be taken when using these statistics to make such comparisons. For instance, two players may have similar percentages of shots made. However, one player may have a high number of draw shots made while the other player may have a high number of takeout shots made.
Similarly, one team may have been using the hammer for most of its shots while the other team may have been playing without the hammer. In these instances, the performance of each of these teams cannot be compared using the raw percentages of their shots made. However, if each of these teams’ percentages can be weighted according to the importance of each shot and the difficulty of each type of shot, then a comparison of the players or the teams can be made.
Small sample size can make the use of shot percentages difficult for determining the performance of a given player or team. Small sample sizes can cause the percentages of shots made to swing dramatically if a player or a team miss a few shots. For instance, the number of shots made in one end of the ice may not be comparable to the number of shots made in forty shots in a practice session.
Additionally, the skip for a team may make seven draws in one end while the lead for that same team may make draws in the first five ends of the game. In these situations, a calculator cannot determine the level of fatigue or emotional pressure that the players felt while making these draws. However, a calculator can ensure that the games are compared on an even playing field so that no comparison is made between players or teams without recognizing the differences in there performance.
Some of the most common mistake for tracking the performance of a player are recording the shots incorrectly. For instance, some players will only keep track of the shots that they remember making while they are playing the game. This can lead to an inflation of the percentage of the player’s shots made.
The percentage made will not account for the missed shots that the player isnt able to remember. In addition to this, some may place equal value on each made shot. However, the value of each made shot isnt the same.
For instance, a made takeout shot in the last end of the game has a higher value than a made guard in the first end of the game. If the made shots are not recorded correctly, then the percentages will not accurately reflect the performance of a player. For improvement in players, the split of draw and takeout percentages is the area of focus for players rather than their overall percentage.
By increasing a player’s draw percentage by four points while leaving their takeout percentage the same, the player will have an improvement in there performance in the later ends of the game. A team will gain more performance if they work to improve the performance of their players to be even with each other than if the team only includes a player that has a high percentage of successful draws or takeouts. To improve their performance, players should track their draw and takeout percentages separately while also keeping track of the difficulty of the game that they are playing.
By using these set rules and data measurements, the percentages calculated for players will accurately reflect their performance in the game of curling.