TrueSkill Draw Margin Calculator
Estimate the draw margin for board-game ladders using beta, target draw probability, compared player count, team spread, performance variance, and rating confidence.
| Quantity | Calculator formula | What it means | Assumption used here |
|---|---|---|---|
| Draw margin | ε = Phi^-1((p + 1) / 2) x sqrt(n1+n2) x beta | Performance gap still counted as a draw. | Equal-sized compared teams. |
| Performance variance | (n1+n2) x beta^2 | Randomness in one match result. | Same beta for every player. |
| Belief variance | sum sigma_i^2 | Rating uncertainty layered onto the forecast. | Sigma spread is treated as a uniform range. |
| Conservative rating | mu - 3 x sigma | Leaderboard exposure style confidence score. | Uses average player mu and sigma. |
| Scenario | Compared size n1+n2 | 10% margin at beta 4.1667 | Board-game ladder use |
|---|---|---|---|
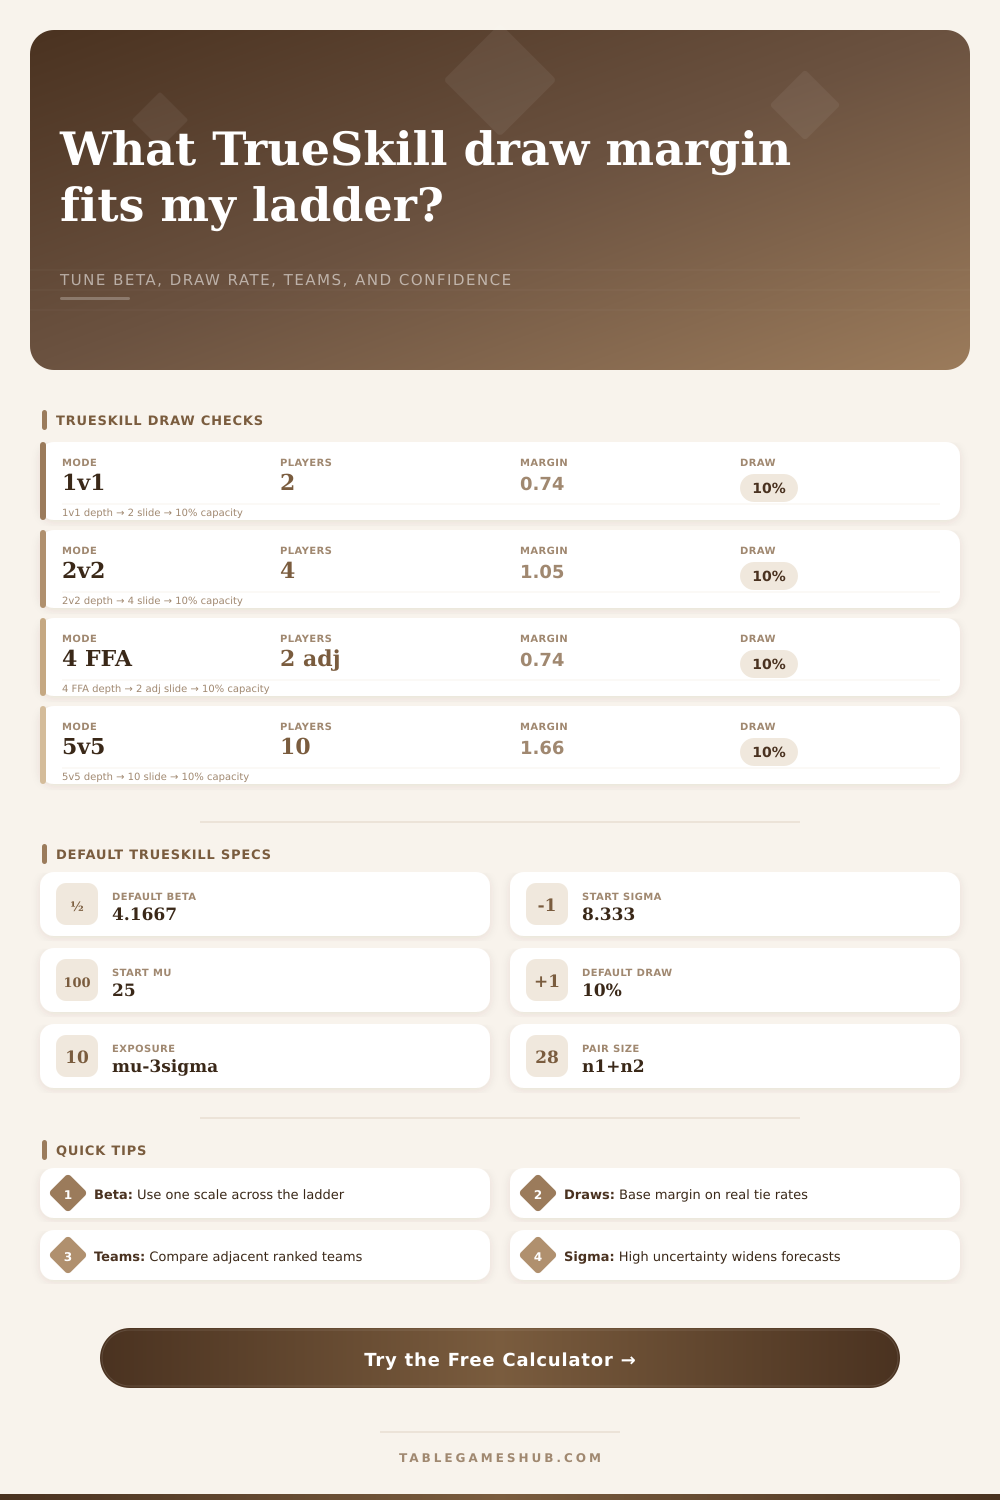
| Solo duel | 2 players | 0.7405 rating points | Chess-like abstracts, tile duels, head-to-head campaign rounds. |
| Two-player teams | 4 players | 1.0472 rating points | Partner trick-taking or two-pair tactical ladders. |
| Four-player teams | 8 players | 1.4809 rating points | Large co-op versus events with stable roster sizes. |
| Five-player teams | 10 players | 1.6557 rating points | Hidden-role team nights with group outcomes. |
| Target draw rate | Inverse normal input | 1v1 margin factor | Best fit in tabletop results |
|---|---|---|---|
| 2% | 0.510 quantile | 0.0355 x beta | Rare ties, most games force a winner. |
| 10% | 0.550 quantile | 0.1777 x beta | Default TrueSkill-style low draw calibration. |
| 25% | 0.625 quantile | 0.4494 x beta | Point-salad games with frequent shared ranks. |
| 50% | 0.750 quantile | 0.9539 x beta | Broad tie bands or casual standings buckets. |
| Sigma to beta ratio | Confidence read | Draw estimate effect | Ladder action |
|---|---|---|---|
| 0.50x or lower | Tight | Draw estimates mostly follow mu gaps. | Good for playoffs and mature club rankings. |
| 0.50x to 1.00x | Settling | Uncertainty still matters but is manageable. | Keep normal pairing and review monthly. |
| 1.00x to 2.00x | Open | Draw forecasts stay wider than the ratings imply. | Use placement rounds before strict seeding. |
| Over 2.00x | Volatile | Confidence is too loose for sharp tie-band calls. | Collect more results before changing beta. |
After a night of board gaming, you gather around the table and look at the score sheet. There are ties everywhere. Was it really a match-up between those teams? Or did luck cancel out any real differance in ability? It’s tempting to go with your raw intuition, but it doesn’t always work here. That’s where statistics come into play. Building up a ladder isn’t simply about who won the previous game; it’s about constructing a system that feels fair for months of playing.
TrueSkill tries to distinguishes ability from luck, but perhaps its most difficult problem is the draw margin, what number should represent how close two performances must be to consider them a tie? Make the margin too narrow, and each small variation seem like a difference in skill level. Make the margin too broad, and no one ever moves up the ladder, because nothing ever changes.
How to Make Your Game Rankings Fair
And finally, there’s beta. Beta is a measurement for how much spread exists in a given type of game. For instance, suppose your starting value for mean is 25. That means beta is 17. Basically, it measures how random or how noisy the environment is. A predictable abstract game will have low beta. A dice-heavy game with lots of randomness will require high beta because a big difference in skill could be hidden by a poor die roll.
You don’t need to attempt to intuitively figure out how much variance team size contribute to this. The tool does all of the nasty math associated with a Gaussian integral for you. Once you enter the parameter, it figures it all out and you’re good to go. Beta is proportional to the square root of the number of players. So if you increase from a one-on-one duel to a two-on-two team match, the combined variance in performance go up. The tool accounts for this in the margin. It makes sure that a tie breaks down in the same way statistically whether you were playing one-on-one or two-on-two.
Sigma represents uncertainty. High sigma indicates a new player who the system doesn’t know much about yet. Low sigma are veterans where the data has converged. Why is this important to consider when drawing? Because if you’re setting a tight draw margin based off the precision of veterans, you’ll see few ties from new players whose confidence intervals are so wide that they estimate overlapping too heavily. That’s why we include the adjusted draw probability in the results panel. This tells you how likely a tie is based on the current uncertainty of those players.
Too low and the system is being overconfident and may penalize players for bad luck. Too high and it feels like your ladder are stagnant. It’s a balancing act between being statistically accurate and making sure players feel good.
The mu gap is something most tournament organizers don’t even notice until it’s already became a problem. Yes, you can compute an ideal margin so that all teams are evenly matched, but real ladders have teams of wildly varying skill levels, and they’ll occasionally be paired together. The interface lets you use the comparison grid to see how sensitive your draw rate is to rating discrepancies. When you bump up the gap by a factor of two between any two teams on either side of the ladder, the chance of a tie should plummet down to around zero. Otherwise your draw margin may be too large.
Ideally you’d have a system where skill disparities overrule luck…eventually. This should only happen after a reasonable number of games. The reference tables let you quickly see what effect changing the target draw rate has on the margin coefficient. Ten percent is standard, though some high-tie formats (e.g., worker placement games) may require twenty-five percent.
Lastly, we have the conservative rating exposure. That subtracts three standard deviations from the average to find a minimum estimate of skill. That’s what’s used to seed brackets and show leader boards where consistency trumps volatility. It’s not simply who won today; it’s who has demonstrated the ability to do it over and over again.
The calculator will spit out those numbers, but ultimately it’s up to you to apply them within your community. A competitive tournament setting have narrower margins than a casual family ladder. Transparency is the objective. The more the players understand how ties occurred or how ratings were adjusted, the more they trust the system. Don’t build that trust by hiding it behind random rules, but by letting the data speak. Feed it your real world tie rates and tweak from there. Start there because it’s the best it’ll be if the math is any good. It’s a little thing, yet it makes a difference for the lifeblood of your ladder.