Points Percentage Calculator
Turn a table-game league record into points earned, maximum points, standings percentage, threshold gap, bonus impact, and forfeit deduction in one auditable score line.
| Component | Points | Formula detail |
|---|
| System | Win | Draw or tie | Best table-games use |
|---|---|---|---|
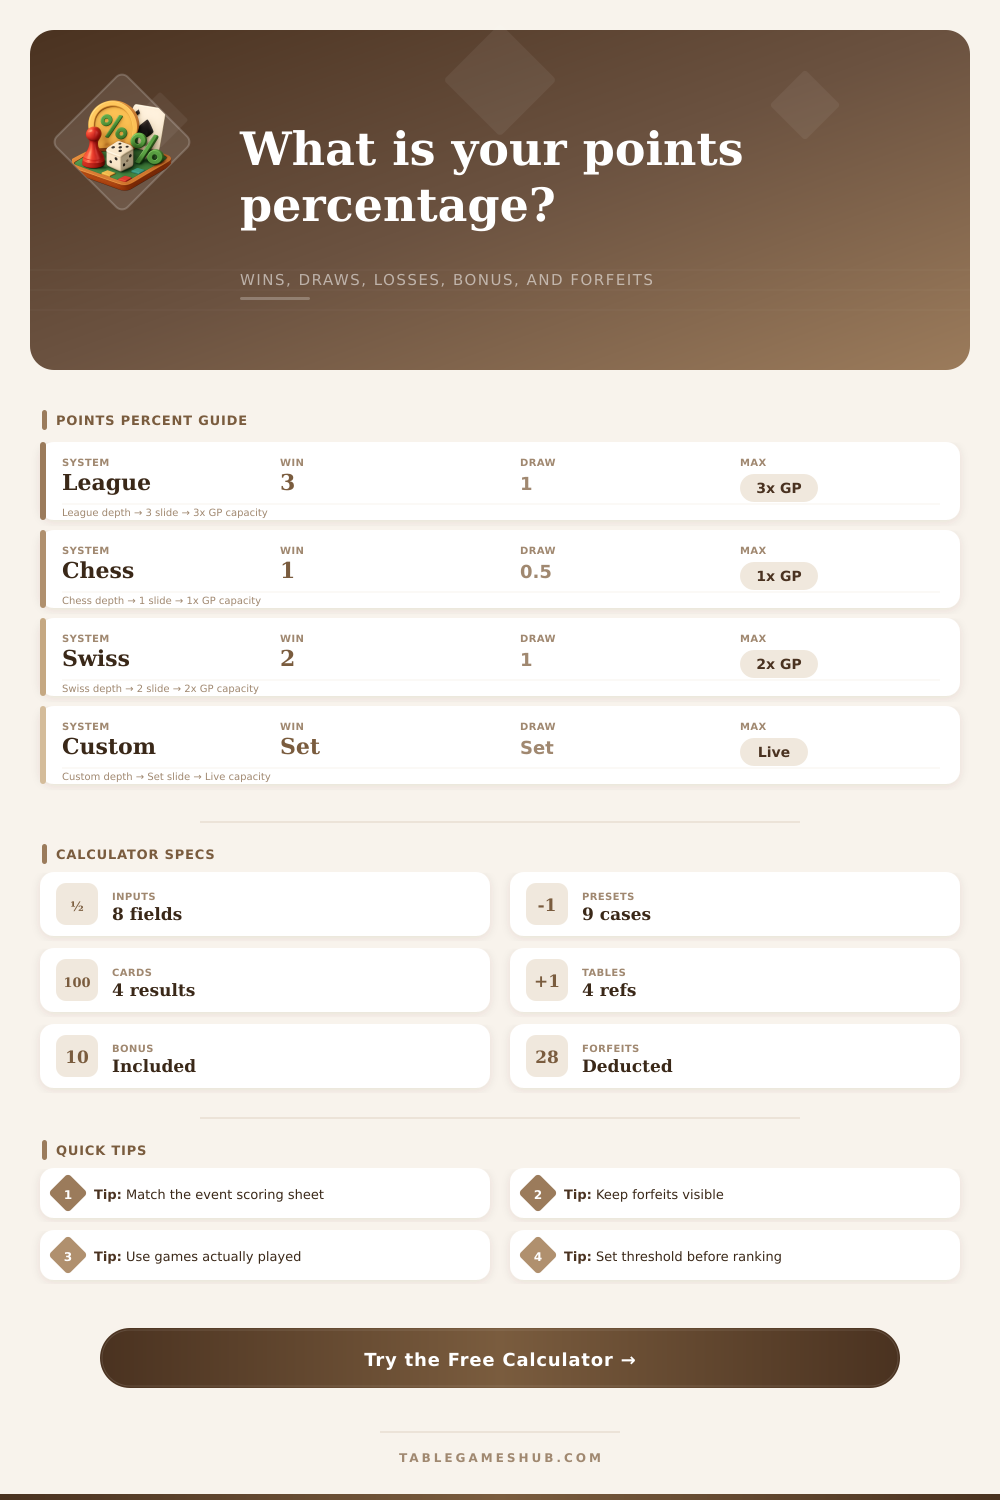
| League 3-1-0 | 3 points | 1 point | Board-game groups with clear win, draw, and loss outcomes. |
| Chess 1-0.5-0 | 1 point | 0.5 point | Chess, Go ladders, and match sheets with half-point draws. |
| Swiss match 2-1-0 | 2 points | 1 point | Tournament rounds where a drawn match splits the round. |
| Round robin 4-2-0 | 4 points | 2 points | Long-format seasons that want standings spread without changing percentages. |
| Bonus league 5-2-0 | 5 points | 2 points | Events that make wins heavily decisive and track separate bonuses. |
| Percentage band | Standing read | Typical use | Score audit focus |
|---|---|---|---|
| Under 40 percent | Recovery range | Early season or rebuilding table | Check forfeits and missed games first. |
| 40 to 50 percent | Near the middle | Casual league pack | Draw value and bonus points can swing rank. |
| 50 to 60 percent | Competitive | Playoff or top-table chase | One win often changes the table position. |
| 60 to 75 percent | Strong contender | Prize table, cut line, or promotion range | Keep bonus and forfeit records visible. |
| 75 percent or more | Leader profile | Top seed or clear first-place pace | Confirm max points denominator is consistent. |
| Adjustment | Calculator treatment | When to use | Audit note |
|---|---|---|---|
| Bonus points | Added after record points | Attendance, objective, table, or sportsmanship awards | Keep bonus separate from wins. |
| Forfeits | Count x system penalty | No-show, invalid roster, or late reporting | Penalty is visible in the breakdown. |
| Games played | Controls maximum points | Uneven schedules or partial round robins | Use counted games, not scheduled games. |
| Threshold | Percentage comparison only | Cut line, playoff seed, or promotion target | Does not change earned points. |
| Setup | Games played check | Scoring system | Threshold idea |
|---|---|---|---|
| Weekly board-game league | 8 to 14 counted nights | 3-1-0 | 60 percent playoff line |
| Chess or Go club ladder | All rated club games | 1-0.5-0 | 55 percent active table line |
| Swiss qualifying event | Rounds actually paired | 2-1-0 | 70 percent top-cut target |
| Round robin finals | Equal opponent set | 4-2-0 | 65 percent medal table pace |
| Bonus objective season | Games plus bonus ledger | 5-2-0 | 75 percent leader pace |
The situation is familiar on those casual league nights, you have the wins and losses noted down, but then someone mention a bonus point or a forfeit and your spreadsheet gets muddled. That’s where points percentage comes in. The result is an honest single number that eliminates the noise associated with uneven schedules. The number tell you how far ahead or behind you are.
It’s as simple as arithmetic. For each point you got, simply divide it by the number of points you could of gotten if everything had gone right. That’s what calculator does for you (above) when you input your record. But that doesn’t mean you shouldn’t know how to plug in the data. Because it ain’t all about wins. It’s about setting a context for the competition first.
What Is Points Percentage
Results are read differently based off scoring systems. One-point systems reward consistency, while three-points-for-a-win systems rewards dominance. Each time you pick a scoring model in the tool you’re choosing to reward one kind of competitor over another. If your league rewards crushing its opponents, pick higher value. If your league prizes strategic draws and close matches, lean towards the lower ones. The reference table on the page show how these systems alter playing field for both the mid-pack player and leaders.
Amateurs make mistakes with their standing draws. They fail to consider that a draw is half a win in one format and no point at all in another. Your draws has to count the same way your league rules say they do. If you don’t enter any of them, or if you put down that they are “neutral” when in fact they are worth points, then you’ll get the percentages wrong. It won’t seem like much each time but it add up over course of a season and can cost you ranking spots.
Forfeits and bonuses plays into those calculations too. Strong performances get dragged down by forfeits; average ones gets bumped up by bonus points for attending. The tool lets you filter out those sorts of adjustment points from your actual win-loss points. That’s what I mean about keeping the audit trail clean. You can look at your standings with and without any league incentives or other such stuff that affects your standing but isn’t necessarily related to playing well.
That makes a difference when the top few players is neck-and-neck in rank. A percentage also helps you determine how well you’re doing toward your goal, whereas a rank only shows where you are. In your group, maybe it’s sixty percent of the way that gets you into the playoffs. If you know what your margin of error is from hitting that benchmark, then each week, you’ll know exactly where you need to be. You don’t have to keep track of everyone else and wonder if they’ll get you down. You just see a real milestone to reach.
Common errors include using scheduled games when schedules aren’t even instead of using the ones you actualy played. The person who got skipped gets fewer max points than everyone else. Only count the games that contributed to your standing. Raw points in an uneven schedule penalize people with fewer game. Percentage normalizes for opportunity and is fairer measure. It evens the playing field.
If you track your points percentage, then it’s up to you to evaluate yourself. Luck and your opponents is out of your control, but your self-evaluation is within your control. Stop guessing and stop arguing by knowing exactly how your actual score compares to your best possible score. That’s going from chaos to clarity.
Get your record out. Look at the bonus points. Let the math speak. Even when your ego doesn’t want to listen, the numbers never lie.