🏆 Playoff Seeding Calculator
Project seed band, cutoff pace, magic number, and remaining-path pressure for major playoff formats.
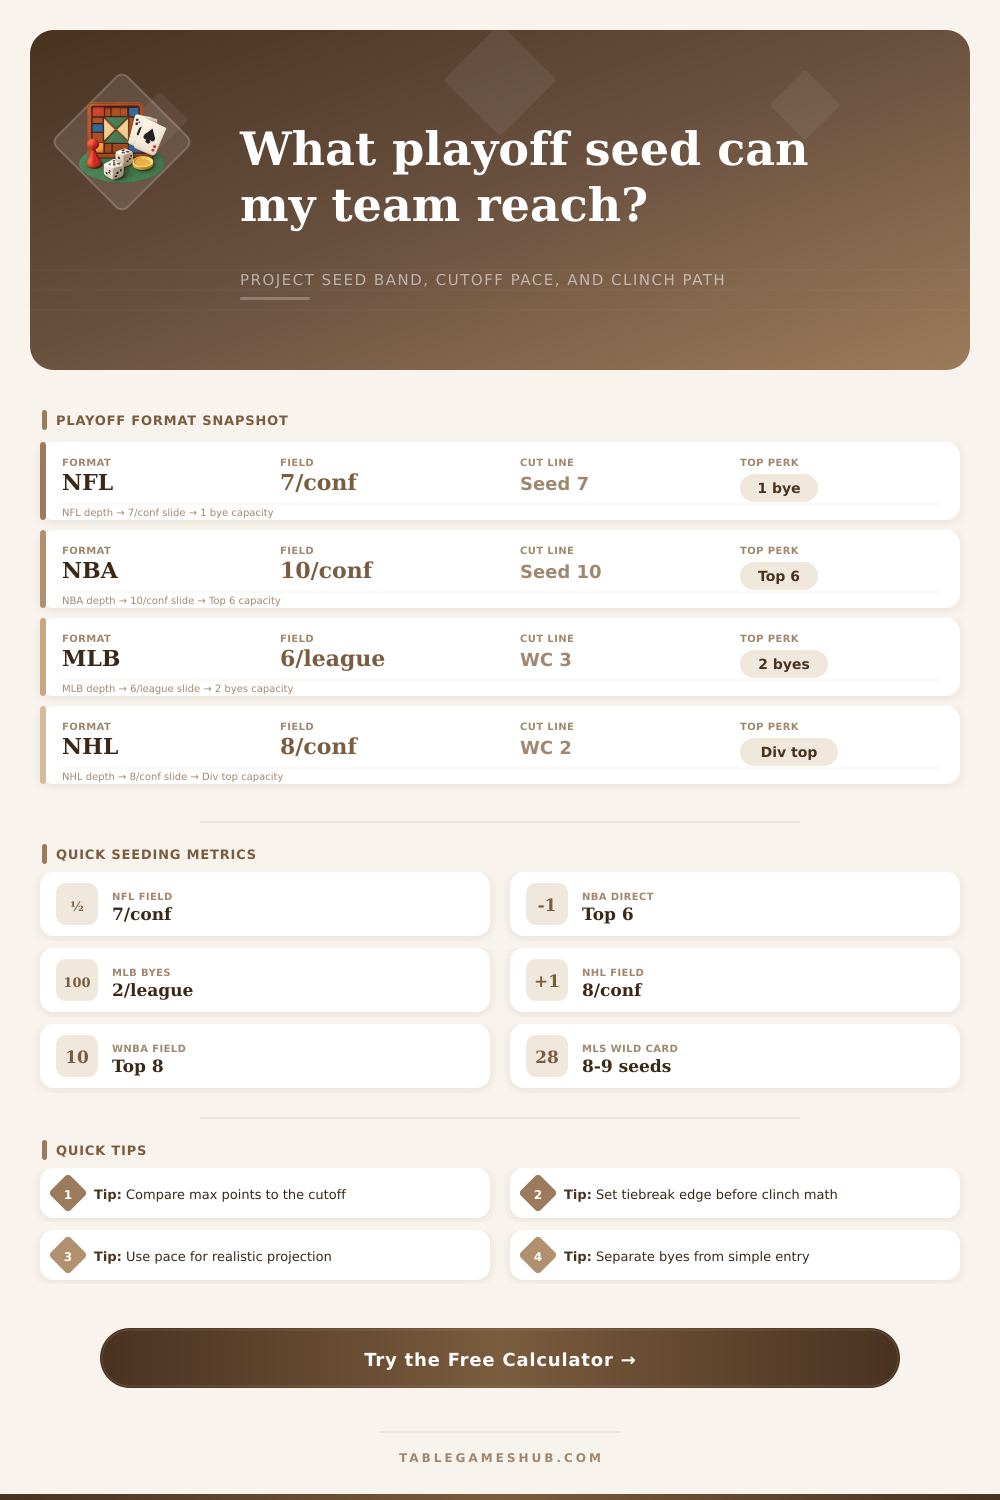
| Format | Qualifying Field | Direct or Bye Line | Seeding Notes |
|---|---|---|---|
| NFL | Seven teams per conference | Only seed 1 gets a bye | Division winners are seeded ahead of wild cards. |
| NBA | Ten teams per conference matter | Seeds 1-6 are direct playoff spots | Seeds 7-10 enter the Play-In path. |
| MLB | Six teams per league | Top two division winners get byes | Third division winner and three wild cards play Wild Card Series. |
| NHL | Eight teams per conference | Top three per division plus wild cards | Wild cards fill the last two conference spots. |
| WNBA | Top eight league-wide teams | No conference split in seeding | Teams are seeded by regular-season record. |
| MLS | Nine teams per conference | Seeds 1-7 go to Round One | Seeds 8-9 play a Wild Card match. |
| Formula Piece | Calculator Field | Formula | Why It Matters |
|---|---|---|---|
| Current points | Wins, losses, ties | wins x W + ties x T | Creates a shared comparison unit. |
| Projected finish | Remaining and finish rate | current + remaining x rate x W | Shows likely seed-line ending point. |
| Cutoff pace | Cutoff points and pace | cutoff + games x rate x W | Estimates the team on the seed line. |
| Magic path | Cutoff max and tiebreak | cutoff max + adj - current + 1 | Tests clinching without relying on pace. |
| Cushion | Projection minus cutoff | projected - adjusted cutoff | Positive values mean the path is above line. |
| Seed Band | Typical Meaning | Calculator Trigger | Planning Read |
|---|---|---|---|
| Bye or top seed | Round advantage or top home path | rank at or above bye spots | Protect the lead and watch tiebreakers. |
| Direct berth | Safely inside main bracket | rank within direct spots | Focus on seed improvement or home edge. |
| Play-in or wild card gate | Qualified, but with extra risk | rank within field but outside direct | One slip can change the path quickly. |
| Bubble chase | Outside but still alive | rank below final qualifying seed | Compare maximum total to cutoff max. |
| Tiebreak Input | Adjustment | Use When | Effect |
|---|---|---|---|
| Own likely tiebreaker | -1 point | Head-to-head or league rules favor you | You can finish level with the cutoff. |
| Unknown or even | 0 points | Tiebreak order is unresolved | Calculator treats the line as exact. |
| Lose likely tiebreaker | +1 point | Cutoff team probably wins ties | You need to finish clearly above the line. |
| Custom formats | User choice | Table game leagues, pools, or house formats | Set the edge that best reflects standings rules. |
Separate realistic pace from clinch math
The projected cutoff tells you the likely race, while the magic number checks the hardest remaining cutoff total.
Match the pool to the format
Use conference pools for NFL, NBA, NHL, and MLS; use league-wide seeding for WNBA and league pools for MLB.
But this is never about talent at the end of a season; it’s always about math. Yes, you have a team that could win, but the bracket don’t care about potential. The bracket only cares about whoever is sitting wherever once schedule is finished. And that’s why knowing about cutoff paces and seed bands matter more than wishing for someone else to lose.
Because sometimes the difference between a play-in game and a first-round bye is less then an overtime loss. Sometimes it’s less than small detail in league manual, like a tiebreaker. This is where calculator does all that work for us. It will show if you’re currently on track to make it as a Wild Card, make it straight in through the door, or miss the cut entirely.
Why Math Matters More Than Talent in Playoffs
There’s no need to manually cross-reference four different standing sheet to see where you stand relative to the team sitting on the bubble. Simply enter your number of Wins/Losses/Remaining Games, and it’ll calculate the cushion metric based off the projected final position of the cutoff competitor, reducing a mess of standings into a simple measurable Cushion.
But that’s something most fans forget about, till it’s too late: That’s your cushion number. If it’s above zero, you’re mathematically in front of the team(s) you’re chasing. If it’s below zero, you have to hope they slip up while you win out.
Your points-plus-projection formula take into account how many points you’ve got now, along with an estimated probability of winning each of the rest of your games. Teams seldom play at their season-averaged level when the playoffs is on the line. If you set a reasonable finish rate, don’t base your strategy or roster decisions on the fantasy version of things where everybody wins by 10 points a game.
These races has silent killers: the tiebreakers. Two team end up even in points in your league, and the tiebreakers; like head-to-head records or division standings, determine who goes up. This is why we have an input for tiebreak position. Is there a good chance that you could earn their tiebreaker? If so, then finishing even with the cutoff team are fine. Do you think they might get yours? Then you really must beat them by at least one standing unit. That is difference of a whole standing unit. That affects the pressure on each of the games still ahead.
The incentives are structured different in crazy ways across various leagues. In the NFL, there’s just one first-round bye (for the top-seeded team), so it’s a brutal race to get that spot. In the NBA, they added a play-in tournament for seventh- to 10th-place teams fighting for a shot at qualifying (a wider but also more uncertain road). In baseball, they give byes to the top seed in each division, which sounds like a nice thing if you’re the team with the best record but happen to finish second in your own division. It feels kind of arbitrary.
So understanding how your own league works is half the battle. You can’t pursue something that doesn’t exist in your format. The tool’s reference tables detail all of this structure well. It shows where the byes originate, number of spots qualifying, and number of direct entry spots. So when you see a seed band label, you know it’s not just “where”, it’s also “what happens next.” Eighth place could be a bye into a home-court advantage or an instant elimination game. The label lets you know not only your position but what is coming up.
One common error is overlooking your opponent’s pace. Fans tend to look at just their team’s schedule from here and forget to ask if that other team they’re pursuing is doing anything easy down the stretch. They have five games remaining. Are they playing against easy competition? Their expected percentage will rise rapidly, and so your margin diminishes. It’s not a fixed figure. It’s a race.
The reality is playoff seedings are all about pain and probability. How much variance can knocks you out before the very next game? If you have any kind of cushion, make sure to protect it. If you’re chasing, go for it with aggression.
On paper, the standings may appear calm on Tuesday night. But the numbers don’t lie, the math doesn’t deceave you, and there’s a difference between magical clinch numbers and realistic paces. You should of checked the math earlier.