🃏 Match Win Percentage Calculator
Calculate tournament match win percentage from wins, losses, draws, byes, intentional draws, dropped rounds, scoring rules, floors, caps, and remaining round targets.
Your current MWP is above the selected target if you win at least one remaining match.
Live remaining round target table
| Scenario | Final record | Final points | Projected MWP |
|---|---|---|---|
| Current | 3-1-1 | 10 | 66.7% |
Common tournament MWP records with 3-1-0 scoring
| Record | Match points | Raw MWP | Standings read |
|---|---|---|---|
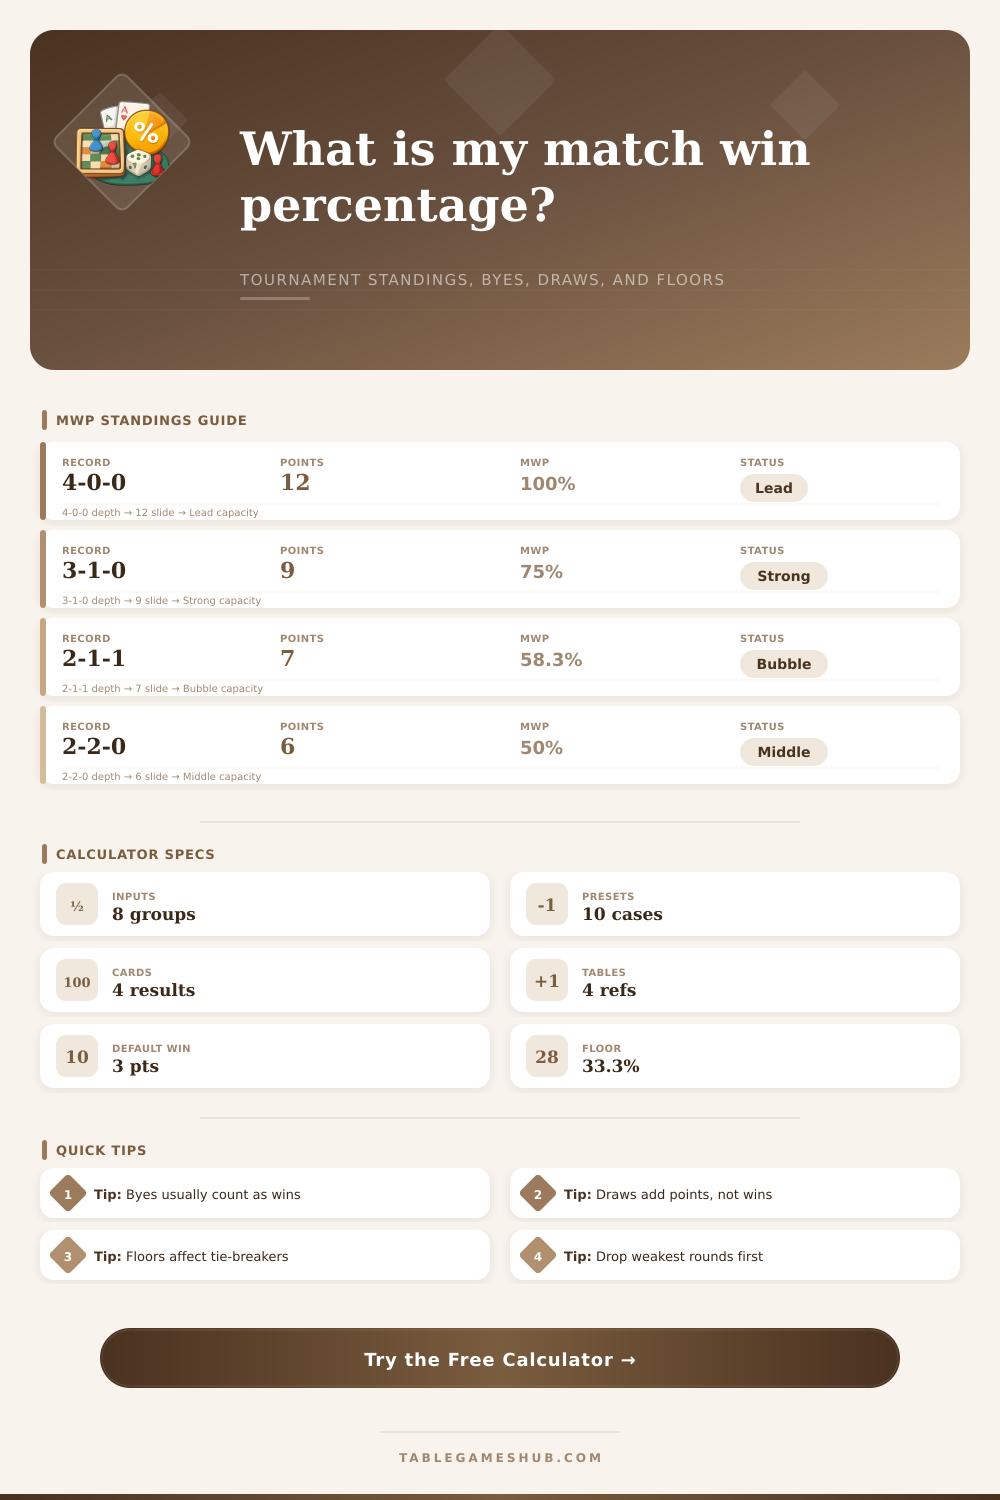
| 4-0-0 | 12 of 12 | 100.0% | Perfect record; usually top seed range |
| 3-0-1 | 10 of 12 | 83.3% | Undefeated with one draw |
| 3-1-0 | 9 of 12 | 75.0% | Strong Swiss position |
| 2-1-1 | 7 of 12 | 58.3% | Bubble or middle-pack position |
| 2-2-0 | 6 of 12 | 50.0% | Even match record |
| 1-2-1 | 4 of 12 | 33.3% | At a common floor threshold |
Scoring rules and floor behavior
| Standings format | Win / draw | Typical floor | Use in calculator |
|---|---|---|---|
| Trading card Swiss | 3 / 1 | 33.3% | Opponent and match win percentage checks |
| League table | 3 / 1 | 0.0% | Season standings with raw percentage |
| Chess match scoring | 1 / 0.5 | 0.0% | Team match or board result percentage |
| No-draw bracket | 3 / 0 | 0.0% | Win-loss-only events and elimination pods |
| Capped carryover | 3 / 1 | 40.0% | Leagues that limit standings percentages |
Remaining match target guide
| Target MWP | Meaning | Shortcut check | Common use |
|---|---|---|---|
| 50% | Even pace | Points earned equal half of maximum | League survival or mid-table benchmark |
| 60% | Positive record | Two wins for every one loss is usually safe | Team matches and short leagues |
| 70% | Cut chase | Needs more wins than draws in remaining rounds | Top cut bubble in medium events |
| 75% | Strong seed | Equivalent to 3-1 over four rounds | High seed or playoff qualification |
| 83.3% | Undefeated pace | One draw across four rounds still qualifies | Final-round intentional draw math |
Dropped round handling examples
| Entered record | Dropped rounds | Counted record | Why it changes MWP |
|---|---|---|---|
| 3-2-0 | 1 | 3-1-0 | One loss is removed first |
| 2-1-2 | 2 | 2-0-1 | Loss is removed before one draw |
| 4-0-1 | 1 | 4-0-0 | Draw is weaker than a win |
| 5-0-0 | 1 | 4-0-0 | A win drops only when no weaker result exists |
Match win percentage help determine whether a draw is worth taking to stay in contention or whether it will kick you out of the bubble zone. It turns every win, loss, bye, and draw into a single figure that tells you where you stand at any point in time. Enter your record and let the calculator take care of the rest. When seconds tick down no complicated calculations is required.
Points are just half of the story. Most players only consider raw points. However, win percentage show how well you did relative to all of the opportunities that was given to you. It compares a five-round tournament to a three-round event. If you had a perfect record in each one, it would give you the same percentage even though the points might be differenter.
Why Win Percentage Matters
That’s why win percentage is a good tie-breaker if there are two people with the same amount of points. It evens things out so you’re forced to look beyond just accumulation but instead look at efficiency as well. Be careful with how you count byes and draws.
In most Swiss formats, byes are free wins, they give you a full point without any chance of losing it. Some systems increase your percentage very rapidly since the number of played match (the bottom number) doesn’t rise even though your score do. Draws are more complex, since they’re technically half-points, which seems like a harmless half-point… except too many of them limit your potential highest finish. Draw every single match after this one and you could end up capped out at a fraction of what’s necessary to make the top eight. Putting these into their own categories help show the effects of each choice.
The next level of complication that trips up beginners is floors and caps. A floor helps keep your percentage from being skewed too hard by bad luck or a low number of match. If your tournament has a floor, it’s like insurance on small samples. For example, some tournaments set theirs at 33 percent so that everyone stays included and stays in the running for any tie-breakers.
On the flip side we have caps. These will cap your high end if there are bonus points or extra rounds. This keeps the standings stable and prevents someone with one lucky outlier from dominating the board by a technicality. Knowing if your event has a floor matters, as it affects your minimum viable strategy. If that’s an option available to you then there are also other strategic tools to use.
Another is dropping rounds. In most formats, you calculate your final standing by taking out your worst performances. So winning all of them except for an early loss doesn’t necessarily mean it’ll harm you more than you might think. Losses count lower than draws so you drop those before your wins. You drop losses before draws. Basically, this focuses on having positive outcomes… Which will reward being consistent in the long-term while allowing for a bad day here or there. Dropping one loss could of very well leave your effective record intact, changing how you go into the final rounds.
You also need to consider the number of targets left on deck and how many you really require to reach a particular percentage goal. For instance, if you’re targeting seventy-five percent, which typically indicates a solid seed, you may discover that instead of needing three more wins, you merely require one. This information will change your risk profile as you now know that you can tighten up your strategy since the wiggle room has narrowed significanly.
On the flip side, let’s say you’re pursuing a cut and therefore require two wins across two games, now you’ve gotta force an aggressive hand. The calculator shows those scenarios so you don’t have to guess. The table includes a set of reference tables that show the percentages for common scores when using standard fish scoring. So a three-one-zero record is seventy-five percent. This is commonly used as the mark for being in contention for a playoff spot in medium-sized events. A two-one-one results in approximately fifty-eight percent, smack-dab in the middle where all tie-breakers are won or lost. It can help you adjust your expectations by showing what others is accomplishing and where it ranks relative to yours.
Match win percentage is less about arithmetic and more about perspective. Perspective matters. Perspective removes all the fluff… The points; and leaves only how well you played. After the final round has been played, you’re not going to recall each game’s exact score. What you’ll recall? Did I hold my own? Or did I fold under pressure?
Your percentage provides a clear line to follow, which means you can control that pressure. It allows you to turn uncertainty into something you can handle.