Goal Difference Standings Calculator
Model points, goal difference, goals scored, remaining matches, and tiebreak pressure for league tables and group standings.
| Competition style | Common matches | Main rank order | Calculator use |
|---|---|---|---|
| Domestic league | 30 to 38 | Points, GD, GF | Season finish projection |
| World group stage | 3 | Points, GD, GF | Final matchday swing |
| League phase | 6 to 8 | Points, GD, GF | Qualification cutoff chase |
| Small round robin | 4 to 7 | Points, GD, GF | Local tournament table |
| Scoring system | Win | Draw | Best for |
|---|---|---|---|
| Modern football | 3 points | 1 point | Most soccer standings |
| Classic two-point win | 2 points | 1 point | Older tables and custom leagues |
| No-draw format | 3 points | 0 points | Games with overtime winners |
| Custom house table | 2 to 5 points | 0 to 2 points | Board game leagues or table nights |
| Tiebreak method | Checks first | Checks next | Calculator note |
|---|---|---|---|
| Goal difference first | Points | GD, then GF | Default setting here |
| Goals scored first | Points | GF, then GD | Useful for attacking bonus tables |
| Head-to-head first | Points | Matchup result | Use GD as later fallback |
| Wins first | Points | Total wins | Common in some league formats |
| Situation | Your GD | Rival GD | Swing needed |
|---|---|---|---|
| Level table | +5 | +5 | 1 goal |
| Close chase | +8 | +10 | 3 goals |
| Big chase | -2 | +4 | 7 goals |
| Ahead on GD | +14 | +11 | Already ahead |
And then it happens; the final whistle sounds, and your heart sinks as you realize you have lost by a single goal. Then you reflect and think: how unfair! Of course, you might recall that league tables isn’t simply measures of who has won or lost. Rather, they’re complex mathematical formulas in which a very close win weighs heavily, while losing by a wide margin doesn’t hurt so much if both sides end up with equal points. That’s where goal difference comes in.
A static table becomes a dynamic hierarchy of ranking, rewarding those teams scoring most goals and penalizing those that fail to keep them out. No, you don’t have to be a mathematician to know this; all you need do is look beyond the bare score line and recognize what really happened on the field.
Why Goal Difference Matters
It is understandable that it’s based off primarily around points. Most fans fixate completely on this single measure, as that’s what sorts them out. But points aren’t everything. They’re actualy half the story. If two teams have exact same record, the league requires a means of breaking ties. In most major competitions, that answer is goal difference: the number of goals scored minus the number of goals conceded.
If one team win three games by scores of 1-0, they earn the same amount of points as a team that wins three games by scores of 5-4. The second team, though, builds an enormous positive differential at the expense of risking many, many goals defensively. The calculator does all that work for you. It’ll project your final table placement based on your results so far. Then it’ll factor in your remaining fixtures and the chances of winning each game. Then it’ll tell you if you’re really safe … or simply fortunate to hold a lead on paper.
It’s here, at the end of the season as points start converging, where it gets interesting. And this is where the buffer factor comes into play. Knowing how far away you are from a qualification point means something, particularly if you’re chasing one, but knowing how many goals you need to change the outcome is critical. You can enter rival stats and expected performance rates. That way, you can run through what-if scenarios for the best and worst cases.
Worst case). Say you project scoring 1.6 goals per game but giving up one. Your goal differential increase by an average of.5 goals per match. Do that over five remaining matches, and that compounds to some serious movement. From there, it’s not about hoping for anything, just margin management.
The second layer is the secondary tie-breaker. Many leagues will then turn to goals scored. This rewards attacking football at all times… Including chasing the runners-up spot or playing dead rubber matches. Scoring three goals in a game is better than scoring one. It increases your points total and gives you a larger margin for error (the goals for column). Now casual fans may assume that any result is the same but they overlook this subtle distinction.
To explain: the page has a handy reference table which details the order of importance given to each metric based off the format of the competition. The fewer the number of games in the group stage, the more each individual goal matters. In a lengthy domestic league, mistakes even out over time. But you have to think strategic with the numbers and the schedule.
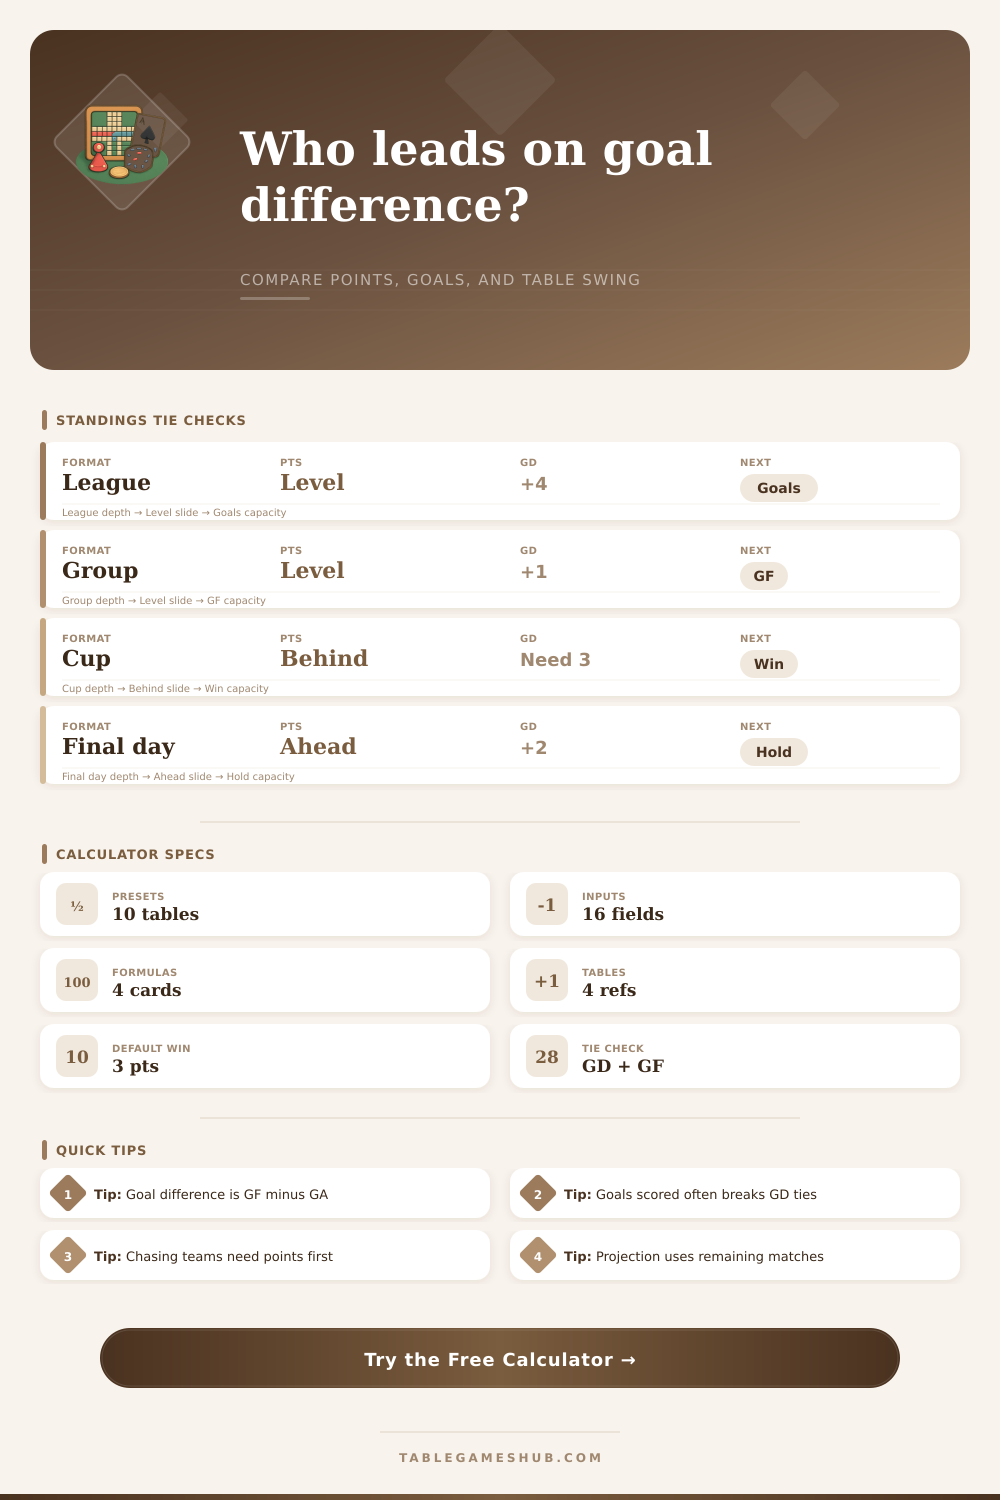
If your team is ahead on points, perhaps even with difficult matchups remaining; then your goal differential becomes more important, so you may be willing to settle for a draw rather than risk losing. But if you’re chasing them, then drawing 0-0 won’t help improve your differential, so you need to score goals no matter what. Drawing 1-1? That’s fine; it keeps the momentum alive. This is how you shape a late campaign.
Not only do coaches aim to win three points, but also to increase the metric that will eventually decide your standings once all those points becomes equal. So in summary, the table gives an idea of who is performing well, it’s built on wins. However the texture is given by goal difference, showing which teams have been dominating, and which ones just scraping through. And this is where understanding this interplay of factors takes you from the realm of just tallying up the wins to seeing the richness of competitive balance. Sometimes it’s that one digit that separates elation from devastation.