Expected Wins Calculator
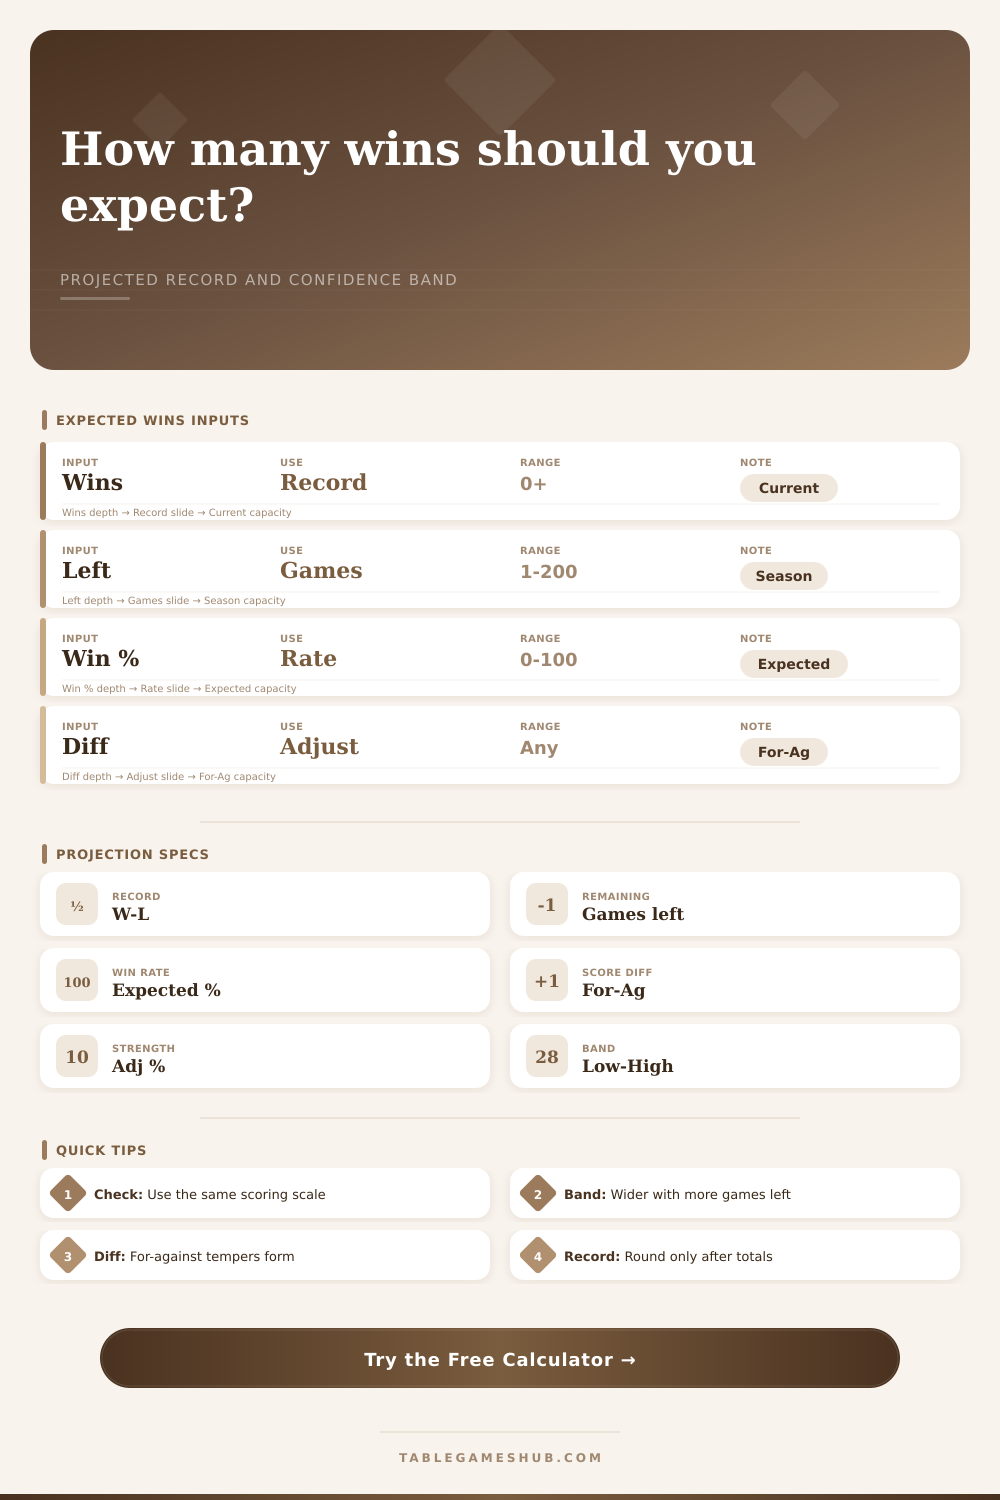
Project final wins, losses, win percentage, and a confidence band from current record, remaining schedule, scoring margin, and strength adjustment.
| Win Rate | 10 Games Left | 25 Games Left | Use Case |
|---|---|---|---|
| 40% | 4.0 wins | 10.0 wins | Chasing a recovery line |
| 50% | 5.0 wins | 12.5 wins | Neutral strength finish |
| 60% | 6.0 wins | 15.0 wins | Above-average projection |
| 70% | 7.0 wins | 17.5 wins | Strong favorite in schedule |
| Score Signal | Differential Pattern | Projection Effect | Watch Point |
|---|---|---|---|
| Even | For close to against | Small or no adjustment | Record carries more weight |
| Positive | For above against | Raises adjusted rate | Large blowouts can overstate form |
| Negative | For below against | Lowers adjusted rate | Narrow losses may rebound |
| Volatile | Wide scoring swings | Wider confidence band | Use a higher confidence setting |
| Strength Adjustment | Meaning | Typical Trigger | Calculator Impact |
|---|---|---|---|
| -10% to -15% | Hard finish | Tough opponents or format shift | Reduces remaining win rate |
| -5% to +5% | Near neutral | Balanced schedule | Keeps projection anchored |
| +10% to +15% | Favorable finish | Better matchups or home table edge | Raises expected future wins |
| Manual override | Context input | Lineup, fatigue, table draw | Applies after score differential |
| Comparison Grid | Conservative | Baseline | Aggressive |
|---|---|---|---|
| Expected win percentage | Input - 5% | Input as entered | Input + 5% |
| Score margin weight | Light blend | Standard blend | Full confidence in margin |
| Best for | Planning floor | Main projection | Upside scenario |
| Interpretation | Lower win target | Expected record | Higher finish range |
Take that guesswork and put it in a spreadsheet called an expected wins calculator. By inputting your score differential, remaining games, schedule strength, and current standings, you can see where you stands now and where you will likely finish at the end of season.
What I found was that the first input; the one you’re most likely to be able to fill out easy, isn’t the easiest one to interpret correctly. Because it represents what’s already happened, your current wins and losses are baseline. That only tells half story; the rest of the games force you to look forward to face the future.
How to Use the Expected Wins Calculator
It doesn’t matter if you’ve got 20 games remaining; there’s plenty of wiggle room. It doesn’t matter if you’ve got three games remaining; every possession count. The tool combines both timelines into one path.
What’s interesting about analysis here is the scoring differential. That’s the For-Ag metric. It’s a sanity check on your win percentage. If a team with a losing record wins by ten points a game, then either they’re really lucky or they was playing super-soft opponents early in the season. If a team are outscoring its opponent by wide margin yet loses close games, it’s probably due for a correction. This gap help adjust your expected win rate based off using the calculator.
It won’t let you rely on a hot streak that may not last and it won’t let you panic when a cold streak happens that the score tells you is an outlier. But then again, there’s the strength adjustment, and that’s where context come into the math. Not every slate left on the schedule are equal. A team can be facing gauntlet of tough competition or a run of cupcakes.
This is where you add a modifier based off reality. The higher the quality of your remaining games (the tougher), the lower you adjust expected percentage. The easier your next stretch of games, the more you bump up. It’s a subjective factor but it’s an important one. To not consider schedule strength would of being to not even acknowledge gravity.
It returns a confidence band (which is the key takeaway) along with a projected record. If the band is narrow, then we have some clarity on where this team will end up. If the band is wide, then there’s a lot of uncertainty, either due to volatility in their form or that they’re far from being done playing. Not a guarantee, but most likely center of gravity is what you’re trying to find here.
There’s also this tendency for people to become too married to their win percentage. “I’m winning sixty percent of my games so I’ll win sixty percent of the remaining games” is something we all thinks. In reality, that’s almost never the case. Regression to the mean is very real. The tool allows you to look beyond your vanity about current percentage and instead focus on underlying performance measures. It is a matter of signal versus noise.
This also help with planning. Say you imagine yourself and realize that you’re not going to reach your goal. Then you can use this tool to find out how many games you must win in order to still be on track. Suddenly, an unseen sense of dread becomes real target. This way, you’ll know exactly what the bar is.
To set those expectations, the tool come with some reference tables. These break down various win rates across both long and short stretches of time. While a high win rate is great for ten games, it’s difficult to sustain over fifty. Knowing this will help you set realistic goals.
It comes down to expectations. How do you expect to play? What’s the probability of a certain result? No matter what happens in a game, that answer remains different than your influence. However, your preparation and mindset are within your control.
That’s where the calculator shines as a mirror. It shows you who you are today. And it tells you who you will be tomorrow. It keeps you honest and grounded.
As a fan, as a player or as a coach, when you know the probabilities, you have fun with the process even more so. The math never influences the game itself, but it definitely influences your experience watching it.