Dice Standard Deviation Calculator
Measure dice roll spread from notation, dice count, sides, modifiers, keep or drop modes, reroll rules, target bands, and confidence intervals.
Enter a notation reference, then adjust the fields below. The calculator reports mean, variance, standard deviation, target-band probability, and a central confidence range from the full roll distribution when practical.
| Measure | Formula | Dice Meaning | Modifier Effect |
|---|---|---|---|
| Mean | E[X] = sum xP(x) | Long-run average roll | Adds directly |
| Variance | Var(X) = E[X^2] - E[X]^2 | Squared spread around mean | No change |
| SD | SD = sqrt(Var(X)) | Typical roll swing | No change |
| Independent sum | Var(A+B) = Var(A)+Var(B) | Normal dice add spread | No change |
| Die | Mean | Variance | Standard Deviation |
|---|---|---|---|
| d4 | 2.50 | 1.25 | 1.12 |
| d6 | 3.50 | 2.92 | 1.71 |
| d8 | 4.50 | 5.25 | 2.29 |
| d10 | 5.50 | 8.25 | 2.87 |
| d12 | 6.50 | 11.92 | 3.45 |
| d20 | 10.50 | 33.25 | 5.77 |
| Mode | Mean Effect | Spread Effect | Best Check |
|---|---|---|---|
| Sum all | Adds die means | SD grows by square root | Damage or movement totals |
| Keep highest | Raises result | Often narrows low tail | Advantage-style rolls |
| Keep lowest | Lowers result | Often narrows high tail | Risk or stress rolls |
| Drop lowest | Raises pool total | Smooths bad outcomes | Ability-score generation |
| Reroll lows | Raises die mean | Cuts the bottom tail | Damage floor comparison |
| Band Type | Example | Reads As | Useful For |
|---|---|---|---|
| Exact total | 7 | Only total 7 | Board-game trigger spaces |
| Closed range | 6-8 | 6 through 8 | Sweet spot around average |
| At least | 15+ | 15 or higher | DC or armor checks |
| At most | <=10 | 10 or lower | Failure or low-roll bands |
You roll a 1 on your d20 and miss the target. That’s variance. Variances excite players at the table they also infuriate them. How much do things differ? What does that mean about your character? That’s where standard deviation come into play. Standard deviation show you how much variation there is in results. Does everything fall around middle or does it spread far and wide. And with that knowledge, you craft a tanky character or a risky glass cannon.
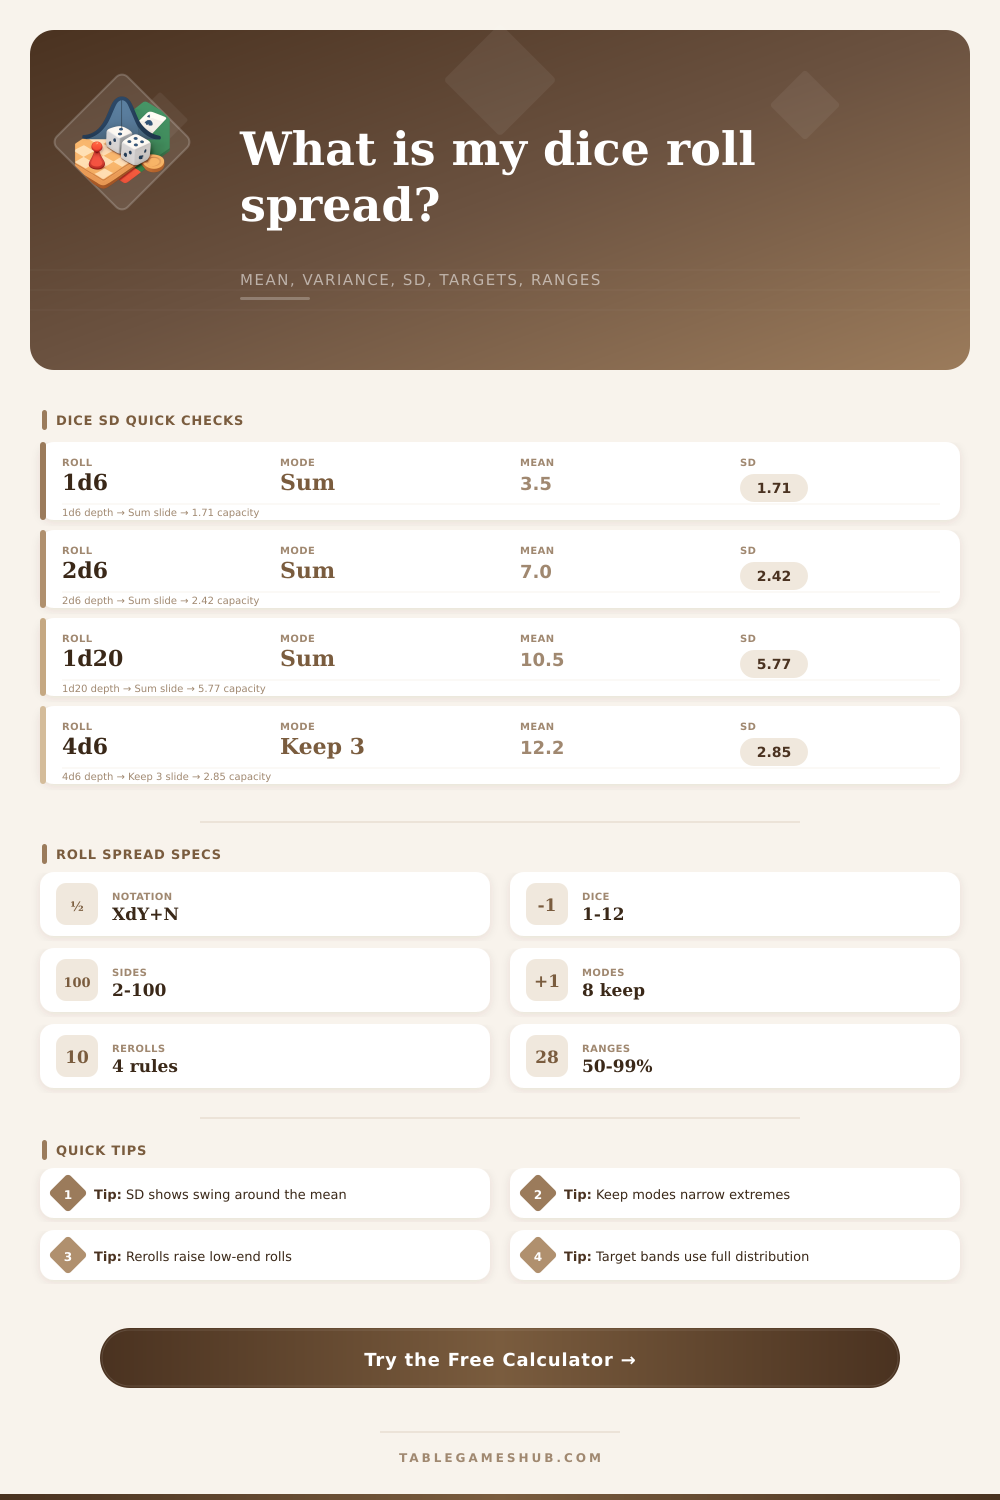
So, there’s no need to memorize the equations. The calculator will do it for you! Next, know what the inputs mean in your game. Dice pool notation represent the set of dice that roll together. For example, two six-sided dice average seven. The standard deviation is a number around 2.4, which explain why most dice rolls fall within four-to-ten. Because of this clustering, two dice are somewhat less random feeling than one d20. Rarely do you get low (or high) numbers; the bell curve tugs everything towards middle.
Using Standard Deviation in Your Game
That’s where the keep or drop rule comes in. It changes how predictable your results are. If you roll four six-sided dice and drop lowest one, your mean goes up. You steadily eliminate bad luck. Your standard deviation also shifts form. You don’t get terrible rolls that destroy your stats. But you cap off the very top a bit. By looking at distribution on the calculator we can see the tradeoff. We’re trying to control how often you get high numbers, not just get higher ones.
The math gets complicated with rerolls. When you reroll ones, it remove the end of the probability curve (i.e., the worst part). That makes your average go up but also decreases the variance (the likelihood of getting something bad). Because it’s rerolling ones, the tool will recalculate based off that condition. What does this mean? It means standard deviation is smaller in a pool with rerolls. This means results are more consistent session to session. Small things can make difference between living or dying.
The flat modifiers are easier to understand, yet no less significant. A five on a roll will raise the mean by five. The standard deviation doesn’t alter. The spread hasn’t changed just where target window is located. This gives you an encounter balancing effect. Someone who has a +5 modifier is less likely to miss. However, their rolls will still bounce all over that new average, just shifted upward. They aren’t as inconsistent but they are in a better position.
This is where things actualy play out. These are bands with target numbers and confidence intervals. What are the odds that your roll will fall inside a certain range? In other words, what’s the probability that I’ll make a roll from 15-20? The calculator displays this information. It works better than showing averages. Monsters don’t get hit by averages. Seeing that you’ve got a forty percent chance of landing in the kill zone affects your decision regarding spells or otherwise. It makes hope strategic.
Dice obey mathematical principles. Dice appear random, yet they’re a tool that can be predicted. Rather than hoping for luck, standard deviation would of help you handle your risks. It’s how you create efficient character builds and campaign designs. It explains when spells miss (and how to remember it) better than your brain ever could. Instead of blaming the dice, you know how the game works.