Dice Histogram Calculator
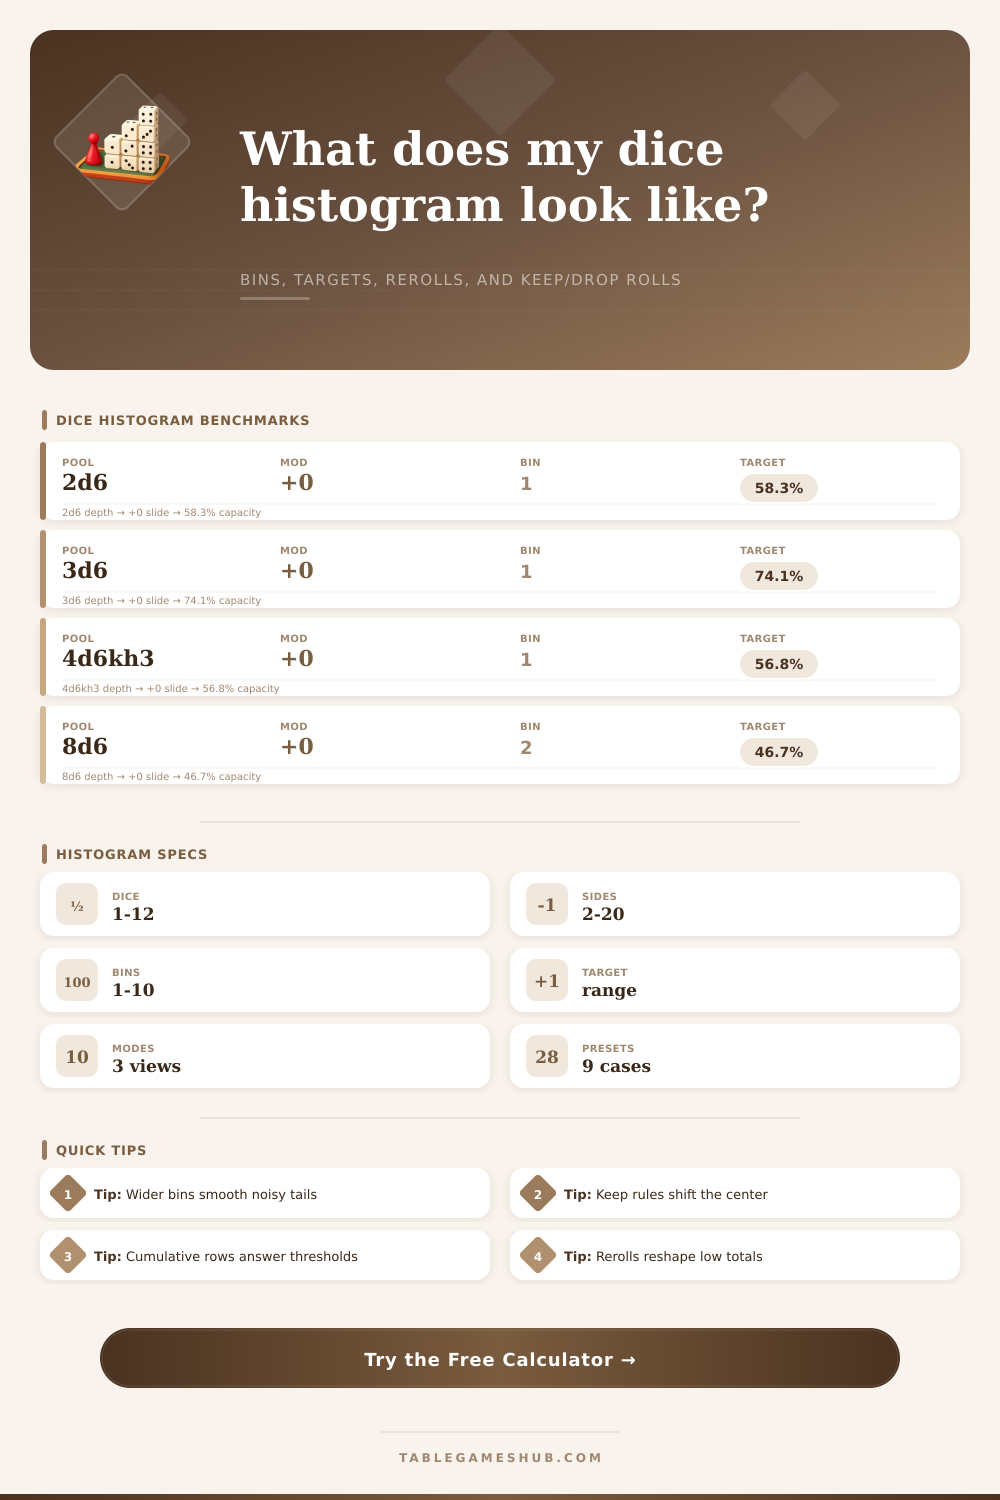
Build a distribution for tabletop dice totals with modifiers, target ranges, bin widths, cumulative modes, keep/drop rules, and common reroll styles.
| Displayed total or bin | Outcomes included | Probability | Cumulative reference | Histogram bar |
|---|
| Checkpoint | Total threshold | Probability | Table use |
|---|
| Bin width | Best for | What it hides | Typical dice pool |
|---|---|---|---|
| 1 total | Exact target checks | Nothing | 2d6, 3d6, d20 |
| 2 totals | Damage ranges | Adjacent spikes | 6d6 to 10d6 |
| 5 totals | Long pool summaries | Fine tail shape | 8d8 or 12d6 |
| 10 totals | Quick table handouts | Small breakpoints | Large custom pools |
| Rule | Histogram effect | Common use | Calculation note |
|---|---|---|---|
| Keep highest | Moves center upward | Ability generation | Tracks kept dice states |
| Keep lowest | Moves center downward | Risk or mishap rolls | Tracks lowest states |
| Drop one die | Removes an extreme | Drop lowest 4d6 | Uses total plus min/max |
| Reroll once | Reshapes die faces | Damage rerolls | Changes per-die weights |
Tabletop gamers eventually reach a point at which they recognize their gut instinct around dice probably isnt correct. “I roll more dice, so I get more,” or “I add a flat modifier, so everything move up.” But it’s not like that.
A histogram helps make sense of probability by giving it a visual representation. It depicts the bell curve within randomness and it illustrates how much weight falls to one side or another of your die roll.
How Dice Rolls Really Work
Dice pools is generally summed up by most player as just that: a sum. Roll three six sided dice? You get a value from three to eighteen. That’s true, but misses the form of the die’s distribution. The center bulge while the tails thin out rapidy.
Knowing what the average might be are far less helpful than understanding the likelihood that you’ll miss the mark. The dice rolling calculator above do all of the tricky math for you and plots out precisely what the chances of each result are. It saves you from having to manually simulate thousands of rolls in order to feel comfortabley with your assumptions.
Drop and keep rules alter shape of this considerably. If you’re keeping the top three from four rolled, then you aren’t merely throwing out a single low number. You’re strongly pushing the whole probability curve towards high end. The average increase, sure, but so does the variance; you discard those nasty rolls where everything goes small. That’s why it’s a common way for character creation system to work. It gives you a better character without making the results feel nearly as random as just rolling more dice and summing them all together.
You can turn on or off these filters and clearly visualize what kind of safety net you’re crafting with the tools. The second thing many overlook is addition of rerolls. While they provide a general increase in success, rerolling ones isn’t the same thing as rerolling low numbers. When you reroll all your ones, you remove the absolute worst case scenario. Your distribution will start to look less like a perfect bell curve and more like a skewed hill to the right.
Why does that matter when calculating damage? Because that means you’re rarely ever going to roll the minimum amount of damage. Your floor is higher then it seems.
This one’s most likely to be overlooked in all probability tools: Bin width. The bigger the bin, the smoother the histogram. In the case of rolling dice, this can hide the jagged nature of individual results. This is good if you want a general idea of what to expect, but bad when you are looking for specific thresholds. A bin width of 2 may throw away the difference between rolling a 12 and 13 entirely.
Decide how big the bins should be depending on whether you’re interested in knowing exact counts or just a rough idea of the distribution. Noisy tails get smoothed out with wider bins… They become less distracting as you look for the underlying shape.
Exact bars and cumulative views ask slightly different questions. A cumulative row asks “How likely am I to roll 15 or better?” But an exact bar say “how likely am I to roll 15?” For pass/fail checks that’s important, because you don’t usually need to know if you’re rolling precisely fifteen. You just want to know if you rolled fifteen or better. Putting your rolls in cumulative mode answer this question directly. It turns the data into a success chart instead of a map showing how it is spread out. This version will often matter more at the table.
This knowledge about distributions also allows you to predict both success and failure. It stops us from making the misstep of thinking that a higher average will translate into a greater degree of consistency. It doesn’t. If you’re rolling on higher dice or more complicated rerolls, then yes, higher averages will often be accompanied by broader spreads.
This knowledge of distribution shapes how you create encounters which seem not only mathematically accurate but fair. Where’s the safety net? What’s the risk? How do I want my rolls to impact the narrative playing out before me? You should of checked your math.