D3 Probability Calculator
Calculate exact d3 odds for 1-3 dice faces, d6 halved conventions, modifiers, rerolls, keep/drop pools, target sums, exact sums, low-roll checks, and success thresholds.
P(1) = P(2) = P(3) = 1/3
P'(v) = kept P(v) + reroll mass x base P(v)
Each outcome mass = product of transformed die odds
Chance = sum of favorable outcome masses
| Convention | D6 to d3 mapping | P(1) | Mean |
|---|---|---|---|
| Fair d3 | Native faces 1, 2, 3 | 1/3 | 2.00 |
| Round up | 1-2 = 1, 3-4 = 2, 5-6 = 3 | 2/6 | 2.00 |
| Half up | Round d6 / 2 with halves up | 2/6 | 2.00 |
| Floor min 1 | 1-3 = 1, 4-5 = 2, 6 = 3 | 3/6 | 1.67 |
| Rule | P(1) | P(2) | P(3) |
|---|---|---|---|
| No reroll | 1/3 | 1/3 | 1/3 |
| Reroll 1s once | 1/9 | 4/9 | 4/9 |
| Reroll 1s and 2s once | 2/9 | 2/9 | 5/9 |
| Reroll 1s until kept | 0 | 1/2 | 1/2 |
| Pool | Range | Mean | Most common sum |
|---|---|---|---|
| 1d3 | 1-3 | 2.00 | 1, 2, or 3 |
| 2d3 | 2-6 | 4.00 | 4 |
| 3d3 | 3-9 | 6.00 | 6 |
| 4d3 | 4-12 | 8.00 | 8 |
| Check | Favorable | Total | Chance |
|---|---|---|---|
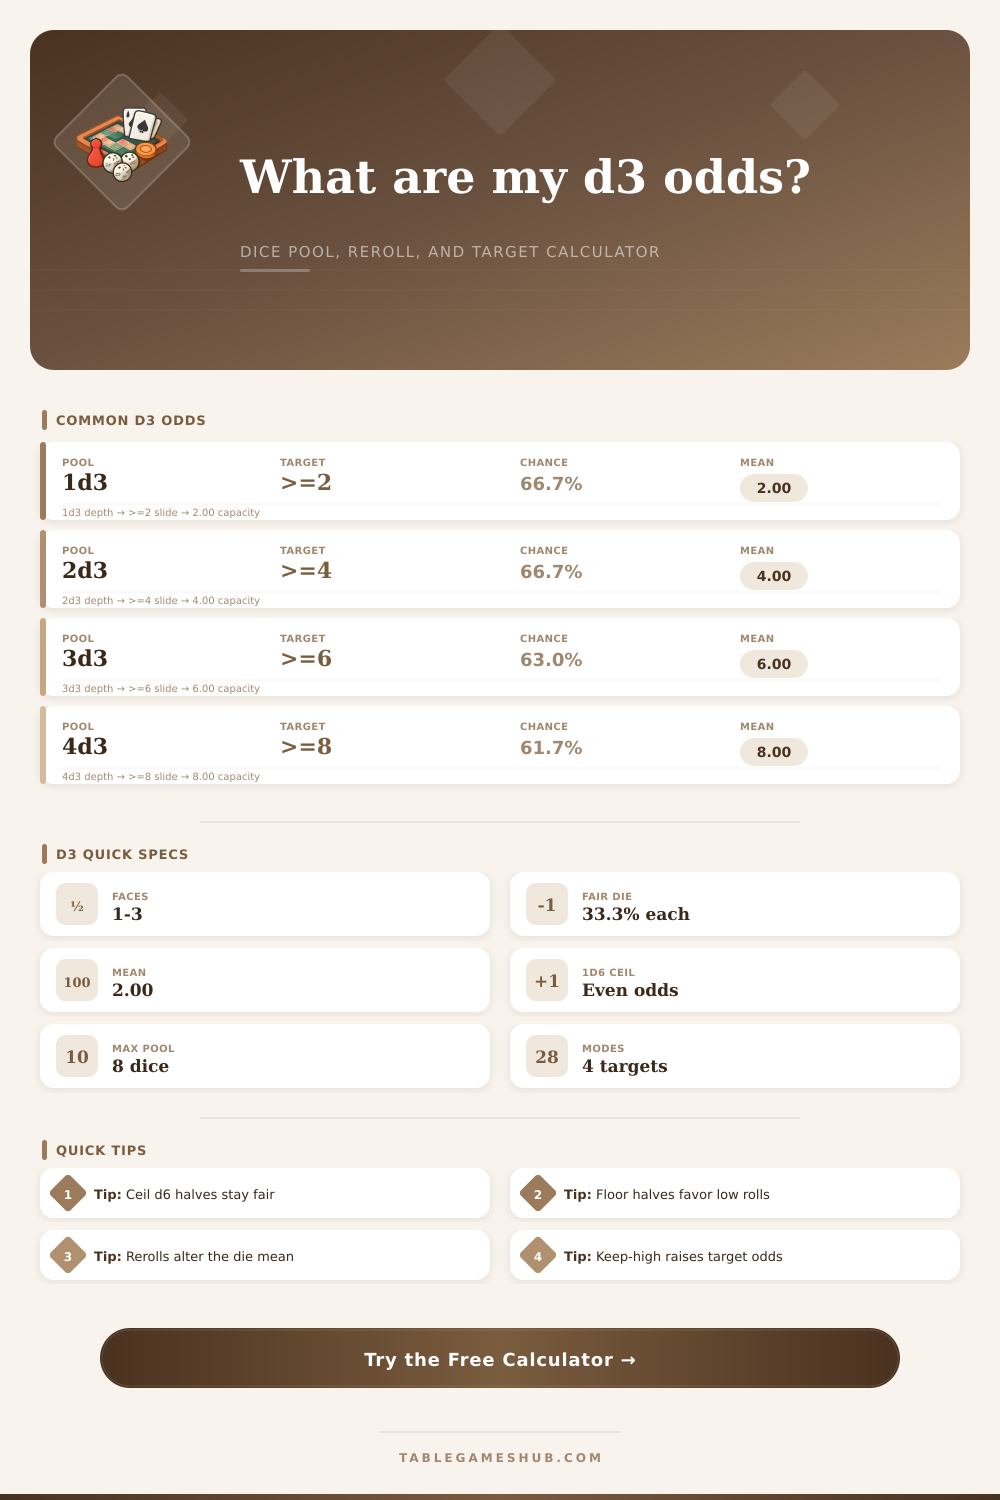
| 1d3 sum 2+ | 2 | 3 | 66.67% |
| 2d3 sum 4+ | 6 | 9 | 66.67% |
| 3d3 sum 6+ | 17 | 27 | 62.96% |
| 4d3 sum 8+ | 50 | 81 | 61.73% |
Here’s one example: You’re playing a tabletop game. It’s your turn. In front of you there is three dice. If your character succeeds at dodging a trap, you roll a d3 pool according to the rules. What’s the chance that you’ll dodge a trap? How do you know? Does it help you to know the average (the mean) is two? Knowing what something “should” happen isn’t going to tell you if it does or doesn’t.
This disconnect, this difference between expectation and experience… Is where probabilitys calculators makes a living. We’d like to believe we grasp things like luck, yet our heads aren’t wired for seeing how drop-low rules or reroll mechanics skews a distribution curve. On paper, the math seems straightforward. Throw in some modifiers and keep-high restrictions, however, and it quickly becomes complicated.
Why You Need a Probability Calculator for Tabletop Games
For example, most d3-based systems use a d6 cut in half. But that creates an interesting question: when you cut a d6 in half, how should you map the results? You could round up, two sides map to each number, keeping things fair-and-square. Or you could cut the d6 down by rounding down the fraction, a flood of ones at the bottom end. That one move shifts all the risk off the roll.
Someone cutting a d6 in half and rounding up (ceiling math) plays a different game than someone who cuts it in half and floors it (floor math). Even though both players think they’re rolling a d3, their house rule is quietly screwing them over.
The calculator I’ve created above does all that work for you, and lists everything so you don’t have to follow every branch on that probability tree yourself. It translates from the original rule to the actual hit chance, showing you whether your house rule is unfairly penalizing you.
The place where people most often overestimate the impact is in rerolls. It’s one thing to think “oh I’ll just reroll ones,” but rerolling ones once has the effect of shifting some of the probability mass off the low end of the distribution to the middle and upper ends, i.e., it increase the mean a bit. In practice, what this means is that you’re taking away the potential for a disastrous result, so there’s less variation in what happens. This gives you more consistency, rather than higher results. Taking out the possibility of a disastrous roll are important. This is useful in situations where failing to meet a threshold causes the entire action to fail. Knowing this can help determine when a reroll rule is worth its resource spending (or narrative cost).
The Keep and Drop rules add combinatorial complexity, and no human being should of tried to work these in their head. Five d3s means keeping the high dice is equivalent to sorting all combinations and taking only the best results. Dropping the low dice does the same, though with a different spread. The result is a much tighter distribution centered on higher values with a drastically increased expected value. In other words: keep/drop rules are meant to smooth things out, but they also narrow the range of outcomes. Sure, you almost never roll poorly. But they also limit your maximum potential more strictly then an unmodified pool would.
This is where the tool comes into play, breaking it down for you and listing exactly what happens when you keep dice, and giving them their proper probability mass. It shows not just whether or not you’ll hit something, but the likelihood you’ll blow past it by a large amount.
The nature of the target matters. When you have a static number to hit, that’s something else entirely. Rolling to beat a static number is different than rolling for a specific sum; one is cumulative, while the other is precise. Since these are two different types of rolls, cumulative and precise; we’ve included an instant toggle in the calculator to switch between them.
It can be difficult to understand how much easier it is to make a threshold check vs. A precision roll, but the drop-off is steeper than intuition suggests. A precision roll, but the gradient isn’t as steep as you might intuitively think. One modifier point can swing your chance by ten percent or more. Where you’re positioned on the curve makes all the difference.
In the end, I think this is why many of us pay attention to the pass rate but not the shape of the distribution: it’s easy, the math isn’t difficult, and it doesn’t tell us much about the mode, what is the most probable result? In a fair d3 pool, the modes (the most frequent sums) will all gather pretty closely around the mean. By adding more dice, the central limit theorem causes those modes to clump even closer together. Eventually, larger pools become very predictable. They are not random chaos, but a machine with an output we can predict. This is why smaller pools retain some sense of excitement and volatility.
And if you want to get into the nitty-gritty of what that means in practice, consult the table of ranges on the page, which illustrates how much the range increases as you add dice. It’s a little detail, but something worth considering when trying to balance the rewards versus the risks.
The bottom line: Probability is simply the map of what’s possible. The calculator maps out the lines. It shows you the cliffs. But ultimately you must decide if you will or won’t leap off. And understanding your probabilities doesn’t mean you’ll win; it means that if you don’t, then it was just bad luck and not bad math.
Go ahead and roll the dice. Confidently.