Bonus Point Standings Calculator
Calculate league table points from wins, draws, losses, scoring events, bonus thresholds, tiebreak stats, and remaining fixtures for bonus-point competitions.
| Profile | Base match points | Attack bonus threshold | Loss bonus threshold |
|---|---|---|---|
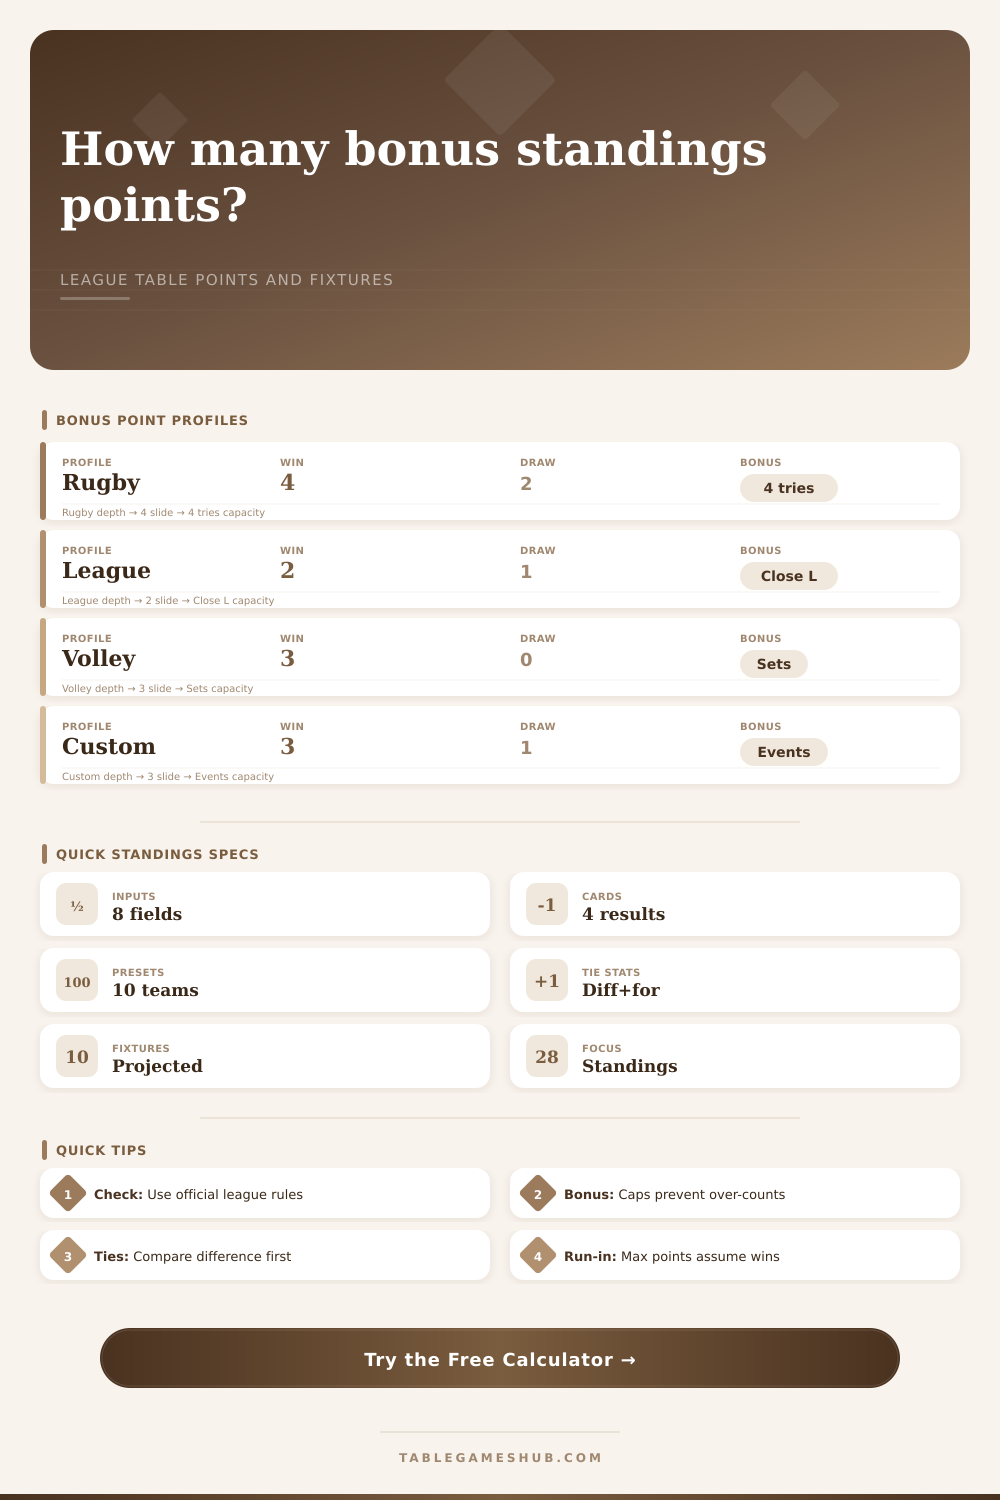
| Rugby union | Win 4, draw 2, loss 0 | Estimated one point per 4 tries, capped by played matches. | One point for close losses within 7 table points. |
| Rugby variant | Win 4, draw 2, loss 0 | Estimated one point per 3 tries, capped by played matches. | One point for close losses within 5 table points. |
| Rugby league trial | Win 2, draw 1, loss 0 | Estimated one point per 4 tries, capped by played matches. | One point for narrow losses within 6 table points. |
| Volleyball sets | Win 3, draw 0, loss 0 | Set bonus pace is estimated from sets won per match. | Five-set losses may earn one point when deficit is narrow. |
| Goal bonus league | Win 3, draw 1, loss 0 | Estimated one point per 3 goals, capped by played matches. | One point for defeats within 1 goal. |
| Custom table | Win 3, draw 1, loss 0 | Estimated one point per 5 scoring events. | One point for close losses within 2 differential units. |
| Calculation layer | Formula | Cap or guardrail | Why it matters |
|---|---|---|---|
| Played matches | Wins plus draws plus losses. | Must be greater than zero for averages. | Controls bonus caps and pace readings. |
| Base points | Wins times win value plus draws times draw value. | Losses add zero unless profile says otherwise. | Shows the points earned before bonuses. |
| Attack bonus | Events for divided by attack threshold. | Rounded down and capped by played matches. | Estimates try, goal, or set bonus pace. |
| Loss bonus | Close-loss estimate from losses and negative average deficit. | Capped by number of losses. | Keeps defensive bonus realistic from aggregate data. |
| Maximum finish | Current total plus remaining fixtures times max per match. | Assumes wins and full available match bonuses. | Gives a clear run-in ceiling without prediction advice. |
| Tiebreak stat | Calculator field | Common priority | Audit note |
|---|---|---|---|
| Points or set differential | Official points or set differential | Often first after standings points. | Positive numbers usually improve table position. |
| Scoring events for | Tries, goals, or sets scored | Common after difference or head-to-head. | Useful when bonus standings reward attacking output. |
| Events against | Tries, goals, or sets allowed | May appear after scoring-for checks. | Lower against total helps defensive comparisons. |
| Event ratio | Events for divided by events against. | Useful in set-based or goal-based tables. | Calculator reports ratio when against total is not zero. |
| Remaining fixtures | Remaining fixtures field | Not a tiebreak, but vital for projection. | Use official schedule counts, including byes if relevant. |
| Run-in situation | Use this input | Projection meaning | Table check |
|---|---|---|---|
| No fixtures left | Remaining fixtures equals 0. | Maximum finish equals current total. | Only tiebreak stats can still move if data is corrected. |
| Standard run-in | Enter scheduled matches still to play. | Ceiling assumes wins and full available bonus points. | Compare with rivals using the same profile. |
| Bye week still listed | Do not count a bye as a playable fixture. | Projection stays tied to matches where points can be won. | Check league table notes for awarded bye points. |
| Postponed match | Count it if it remains scheduled. | Ceiling includes the postponed fixture opportunity. | Update once the official table changes. |
There’s a unique sort of nervousness that occurs during last weeks of a sporting year. It isn’t simply about winning or losing your next match; its about how many points you can gain from the win.
In days past, it was easy: win, you get points. Lose, no you don’t. These days, leagues is complex records. Close losses and flashy offensive play can earns bonus points that lift a mediocre team from a bottom dweller to a finals contender in an instant. A single point, the difference between scoring four tries versus three, can mean the difference between fourth and fifth place. People don’t understand that. They think only about the score, they forget the margin.
Understanding the Sports Calculator Tool
That’s where this tool comes into play. It’s meant to sift through all of that noise. It allows you to take the ingredients of a given season and boil them down into a clear picture of a team’s true standing.
First, you select a profile based off the rules of your particular contest. Volleyball isn’t rugby, and neither of those are like a local football league with its own special scoring mechanics. You don’t have to remember the contents of each rule book (instead), you just input which one you’re working within.
From there, you input the present record. Wins and draws is simple, cold hard cash. Losses becomes more complex, as many contests award points for making a good showing, even if you fall short. Perhaps you lose by a very small margin but you still gain a point. That’s where the calculator comes into play. But it only works if you give it proper inputs.
The variable is the scoring events. What counts as a try? Well, that’s rugby. Goals? Sets won? Other sports. The system take your total output and estimates bonus points for that output. So if you score forty-eight tries over fourteen games, the math say that you’ve had enough tries to get attack bonuses in some of those games. However, the tool doesn’t let the bonuses go higher then the number of games. That’s because it wants to keep things realistic. It doesn’t want to allow the idea of being awarded more bonus points than there are weekends available on the calendar. That guard rail helps to anchor the numbers, to keep them tethered to what is structurally possible given the league format. And it holds back the numbers from straying into full-blown speculation.
The number here isn’t just today’s. The calculator predicts the ceiling, maximum finish given the remaining fixtures. It’s not a prediction; it’s a ceiling, that would be impossible. It’s a ceiling. It tells us if a team has a mathematical chance to hold the one below them at bay, or to catch the one above them. And it lets both fans and coaches know what they should of expect.
When the ceiling is below the other team’s floor, the season might as well be over because there’s no way to play your way in. But when it overlaps, then it’s still a race. Knowing that difference change how you view the last few games. It’s less about hoping, it’s more about needing.
A second set of tiebreak statistics can baffle those new to tournament fishing. Typically, it’s a matter of points difference. So if two teams is tied in standings points, who has the best differential takes the spot? This is determined by comparing total events scored against events conceded. That will tell you quickly if your team is sturdy or flimsy. Sure, 40 points sounds great. But when you look at that column for concessions, there’s a big number there. Now you see it’s vulnerabel. These priorities are clearly spelled out in the reference tables that accompany the tool. You’ll know exactly what to use if there is a tie in points.
At its core, though, this calculator is all about clarity. Gone are the days of guessing what each number means in league table. This takes a wall of numbers and makes it a story of pressure, potential and performance. It lets you see not only where a team sits, but also how they got there, and potentially where they might go next. The math doesn’t lie. All it needs is for you to ask the right questions.