Hypergeometric Probability Calculator
Calculate card, tile, and deck draw odds without replacement, including exact, at least, at most, mulligan, and deck-thinning scenarios.
| Scenario | Population | Success Count | Draw Window | Common Question |
|---|---|---|---|---|
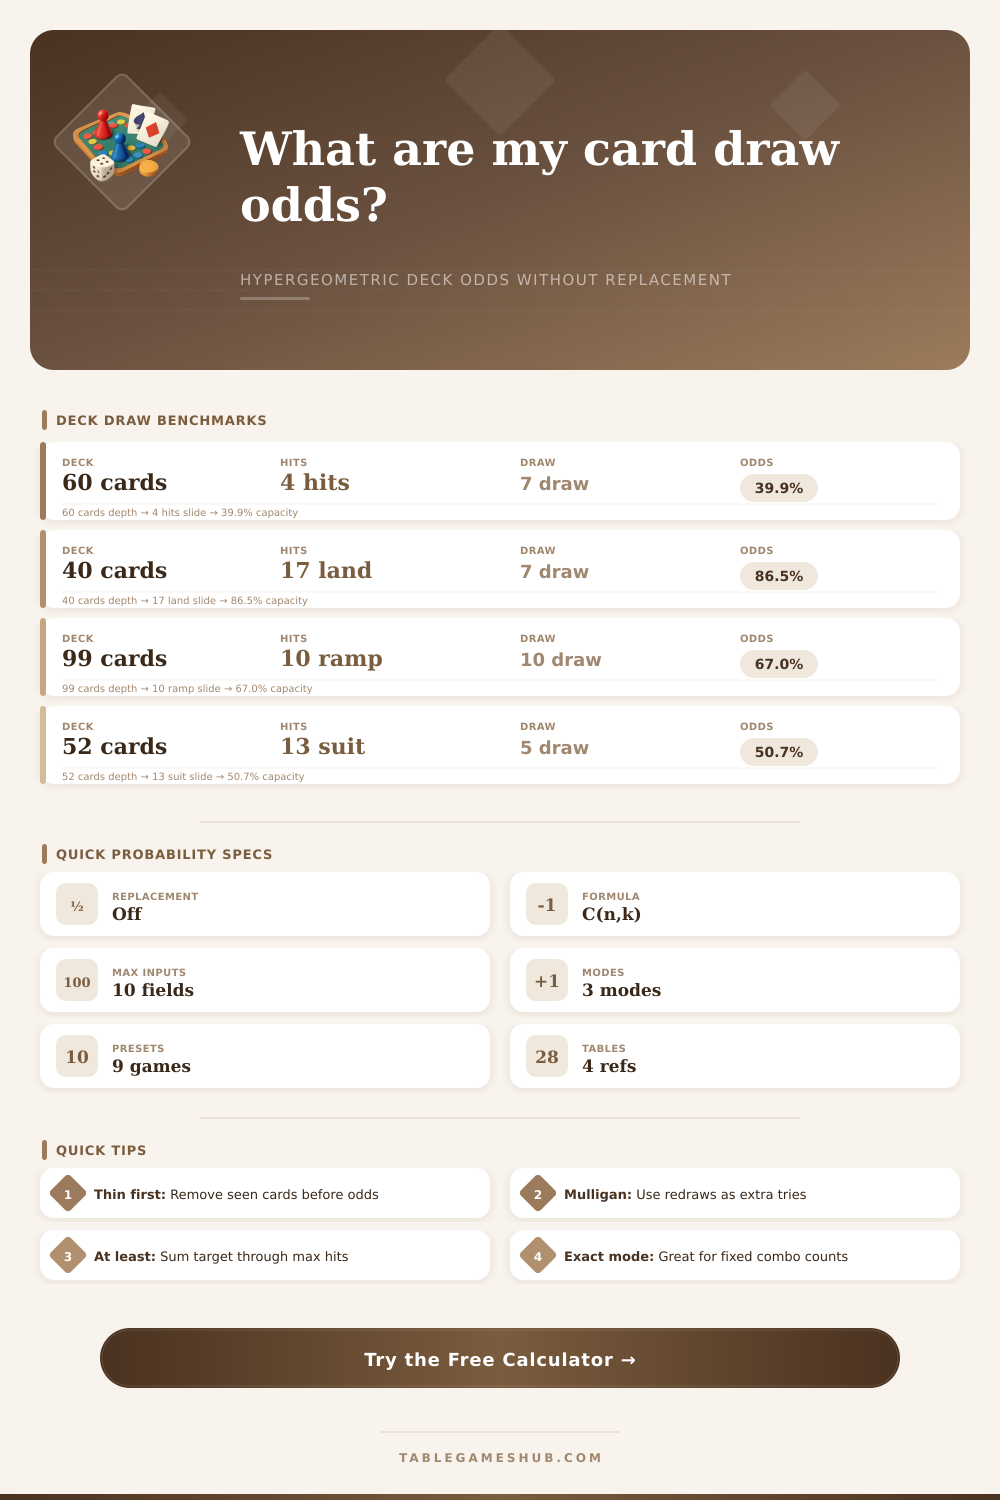
| 60-card TCG opener | 60 cards | 4 copies | 7 cards | At least one named card |
| Commander early game | 99 cards | 8 to 12 ramp cards | 10 cards | At least one ramp piece |
| Poker suit draw | 52 cards | 13 cards in suit | 5 cards | Exactly or at least flush count |
| Deck builder market draw | 10 to 40 cards | Variable card class | 5 cards | Find attack, economy, or defense |
| Probability Mode | Formula Range | Best Use | Example Target | What It Sums |
|---|---|---|---|---|
| Exactly | k only | Fixed count events | Exactly 2 lands | One hypergeometric term |
| At least | k through max | Opening hand keep checks | At least 1 starter | All good counts above target |
| At most | 0 through k | Flood or duplicate limits | At most 3 resources | All counts up to target |
| Mulligan adjusted | 1 - fail attempts | Redraw systems | One free mulligan | Independent fresh attempts |
| Known Removal | Population Change | Success Change | Odds Effect | Game Example |
|---|---|---|---|---|
| Failure thinned | Down | Same | Hit density rises | Search removes non-hit cards |
| Success seen | Down | Down | Hit density often falls | Key card discarded or visible |
| Mixed visible cards | Down | Down by known hits | Depends on ratio | Public board, discard, or market |
| No thinning | Original deck | Original hits | Baseline odds | Fresh shuffled deck |
| Deck / Bag Type | Typical Size | Opening Draw | Useful Success Definition | Calculator Input Tip |
|---|---|---|---|---|
| Constructed TCG | 40 to 60 cards | 5 to 7 cards | Copies, resources, starters | Include extra draws through target turn |
| Commander singleton | 99 cards | 7 plus draw steps | Functional groups | Group similar cards as successes |
| Standard playing cards | 52 cards | 2 to 7 cards | Suits, ranks, colors | Use exact mode for precise hand shapes |
| Token or tile bag | Any finite bag | 1 to 10 pulls | Color, icon, terrain, faction | Replacement remains off for real pulls |
The hypergeometric distributions is used to calculate the probability of drawing specific items from a populations, without replacement. Drawing a card from a game is an example of sampling without replacement. In this scenario, the player does not place the drawn card back into the deck.
The total number of cards in the deck change after each draw. Therefore, the chance of drawing a specific card changes after each draw. For example, if there are sixty cards in a deck and four are specific targets, then the chance of drawing one of these target cards is 4 in 60 for the first draw.
Chance of Drawing Target Cards from a Deck
However, if that drawn card isnt a target, then the chance of drawing a target card on the second turn are 4 in 59. There are different modes of calculating the probability of drawing cards in a deck. The first mode is the “at least” outcome.
This calculates the chance of drawing one or more target cards. Many players uses this mode of calculating because it accounts for every scenario in which the draw is successful. The second mode is the “exact” outcome.
This calculates the chance of drawing a specific numbers of target cards. This mode is useful for decks that require a specific number of cards to function. The “exact” outcome mode provides information for players about the risk of drawing too many of an specific card.
Deck thinning is a process that can alter the probability of drawing target cards. Deck thinning is when players removes non-target cards from a deck. When players remove non-target cards, the density of target cards in the deck increases.
An increased density of target cards increase the chance of drawing a target card. Therefore, removing non-target cards from a deck increases the probability of drawing these desired cards. The hypergeometric distribution can calculate the probability of drawing target cards for decks that has undergone deck thinning.
The distribution can do this by changing the total number of cards in the deck to reflect the number of cards remaining in the deck. A mulligan is a second or third try to draw a specific hand of cards for players. A mulligan is a reset of the initial draw of the hand of cards.
The mathematics behind the calculation of the success of a mulligan are not additive. This means that the percentages of each attempt cannot just be add to find the chance of success. The chance of failure of each attempt can be calculated.
Then, that number can be subtracted from 100%. The result is the chance of success of the mulligan attempts. Therefore, a mulligan can turn a low chance of success into a higher chance of success.
The concept of sampling without replacement can help to explain the feeling of players who have experience a string of failures in drawing target cards. For example, if a player draws a non-target card over and over, they may feel as if they are “due” for a success in their draws. For problems that involve sampling with replacement, such as flipping a coin, the failure in one coin flip does not affect the next coin flip.
However, for problems that involve sampling without replacement, such as drawing cards from a deck, each failure of drawing a target card diminishes the number of non-target cards left in the deck. Therefore, the chance of drawing a target card increases with each drawn non-target card. The hypergeometric distribution is another mathematical concept that can help players to determine the optimal number of copies of a specific card to include in a deck.
Adding more copies of a specific card will increase the chance of drawing that card. However, the returns from adding more copies of a card will eventualy diminish. For example, there may come a point in which adding another copy of a card will increase the chance of drawing that card by only a small percentage.
At this point, the player may determine that the added value of the card is not worth the value of the card slot that would be required to include that card into the deck. By using the hypergeometric distribution, players can determine the best way to balance the number of target cards in a deck with the number of non-target cards needed for versatility and functionality of the deck.