Weighted Dice Average Calculator
Normalize face weights, compare fair and loaded dice, add rerolls or kept dice, and calculate the expected roll total, target chance, success count, and variance.
1Weighted Dice Presets
Choose a realistic tabletop roll model, then adjust sides, weights, target, modifier, reroll floor, or kept dice.
2Roll Inputs
3Face Weights
Weights are relative. A face with weight 2 is twice as likely as a face with weight 1 before reroll rules are applied.
4Dice Component Specs
5Reference Tables
| Fair Die | Expected Value | Variance | Standard Deviation |
|---|---|---|---|
| d4 | 2.50 | 1.250 | 1.118 |
| d6 | 3.50 | 2.917 | 1.708 |
| d8 | 4.50 | 5.250 | 2.291 |
| d10 | 5.50 | 8.250 | 2.872 |
| d12 | 6.50 | 11.917 | 3.452 |
| d20 | 10.50 | 33.250 | 5.766 |
| Roll Model | Mean Total | Target Check | Fair Chance |
|---|---|---|---|
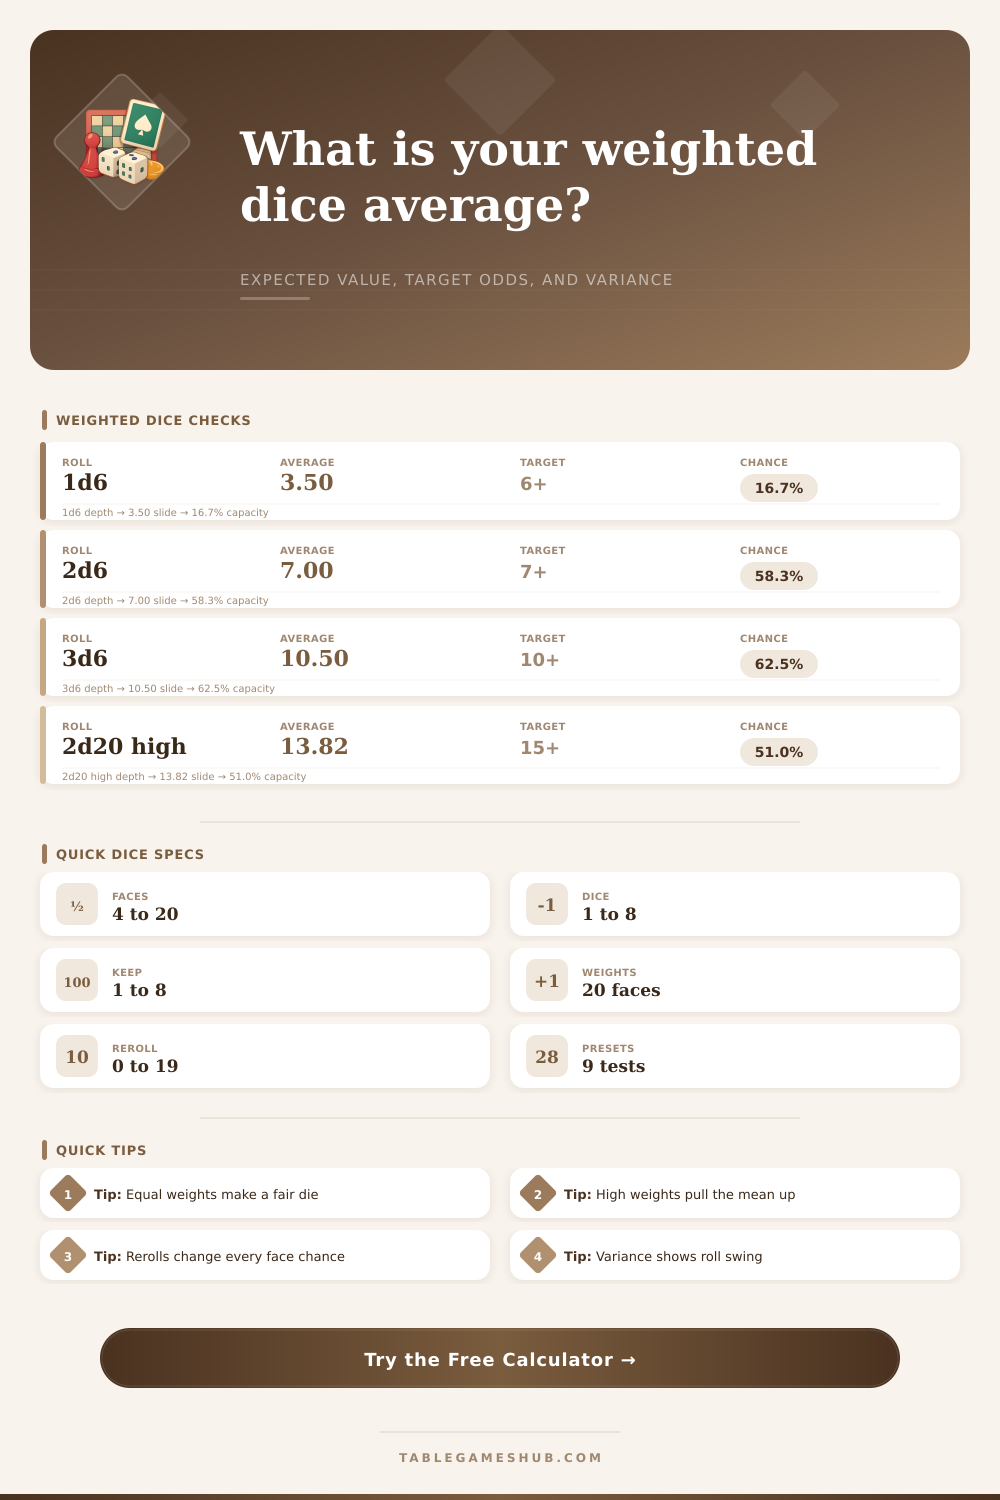
| 1d6 | 3.50 | 6 or higher | 16.67% |
| 2d6 | 7.00 | 7 or higher | 58.33% |
| 3d6 | 10.50 | 10 or higher | 62.50% |
| 4d6 | 14.00 | 14 or higher | 55.63% |
| 2d20 keep high | 13.82 | 15 or higher | 51.00% |
| Weight Pattern | Example Weights | Normalized Meaning | d6 Average |
|---|---|---|---|
| Fair | 1,1,1,1,1,1 | Each face 16.67% | 3.50 |
| High lean | 1,1,1,1,1,2 | Six is twice one face | 3.86 |
| Low lean | 2,1,1,1,1,1 | One is twice one face | 3.14 |
| Ends lean | 2,1,1,1,1,2 | One and six favored | 3.50 |
| Middle lean | 1,2,3,3,2,1 | Three and four favored | 3.50 |
| Formula | Use | Calculator Output | Note |
|---|---|---|---|
| p_i = w_i / Σw | Normalize weights | Face probabilities | All weights must be positive or zero. |
| E[X] = Σp_i x_i | Weighted mean | Average per die | Reroll rules alter p_i first. |
| Var[X] = Σp_i(x_i - E[X])² | Roll spread | Standard deviation | Higher values mean more swing. |
| P(T >= target) | Target odds | Target chance card | Uses exact distribution for the selected pool. |
6Calculation Tips
Weight check: Keep weights proportional to observed roll counts when testing a physical die. For example, use 18, 15, 16, 17, 14, 20 after 100 tracked d6 rolls.
Target check: A higher average does not always mean a better target chance. Review the standard deviation and the likely totals table before comparing two dice setups.
At some point in your life, you’ve rolled dice. Maybe many times. And you’ve felt that need: “I really need to get a six.” But then something happens: That plastic cube rolls across table and settles down…on a one. Is it just bad luck? Or is that die actualy weighted in favor of ones?
That’s an important question in the world of tabletop gaming. After all, most players believe that their dice is fair. They purchased them at a reputable store, right? Unfortunately, things are a bit more complex. How we perceive chance has more to do with mathematical biases different than physical flaws.
How to Test Your Dice with a Calculator
So what can you do when you think there might be a dice bias? You can do this without spending weeks silently rolling it. In this case, the tool I made does all the heavy lifting (above). Enter whatever weights you want on each side of a d20. You can use dice of any number or shape, like four-sided pyramids or twenty-sided gems. Want to give the six more weight? That’s how you load the die in favor of a high roll. Want to know how much of an edge you gain with a reroll rule that says “any one”? Input that in, too.
Vague suspicions become hard data. Do your die curse you? Or not? Does it make a difference in probability, and by how much? Run the simulation yourself, adjusting those weights to see what impact they have. The calculator above will do that instantly. See just what happens to average and how far off it varies under any combination.
Many folks confuse variance with average. “A high average sounds great.” Then they learn it has huge variance. It is like a die where you get one or twenty every time. Sure, ten is the average. But it’s still random. You’ll be a smashing success…or a total failure. You won’t sit right in-between.
Variance captures how much things swing. Consistency means low variance, which is bunching your stuff close to the average. High variance mean things are unpredictable and anything goes. In strategy games, consistent wins more than pure power since you can anticipate it.
Another wrinkle (one that completely transforms the game) is reroll mechanics. A lot of systems have a house rule to allow rerolling of ones. This take out the lowest possible results and pushes average higher. But it also cuts down on variance a bit, since it’s clipping off the low end of the bell curve. With this tool, you can specify a reroll floor and it’ll show you exactly how much convenience that gives to your expected total. In some cases, you may discover that it was less helpful than anticipated, altering your hand strategy accordingly.
Another strong lever is keeping the highest dice of a pool. For example, rolling three dice flat is much more different than rolling four and keeping the best three. By throwing out the bad rolls, your average go up. It’s like having an advantage mechanic that you find in popular role-playing games. Doubling the size of the pool to shape the odds comes at the price of more time at the table. There’s always a trade-off between game flow and math optimization.
These abstract ideas anchor into something concrete when you put on presets. Load up a risk attack scenario and it will tell you what happens if you try. It is a backgammon pair. You’ll be able to look at familiar scenarios and see the math play out. And it will ground your theory; a 2d6 roll has a fifty-eight percent chance of rolling seven or higher. That is something you can use to ground yourself. It’s the stuff happening at the middle of the distribution. The stuff at the edge is rare for a reason.
When you’re customizing weights, you’re effectively drawing a new map: flattening the peak, making edges more common. Our heads have a model for randomness, but that doesn’t align with reality very well. Our mental model says a die is perfectly symmetrical. That’s not how manufacturing works; there are manufacturing tolerances and even slight variations in mass distribution. And they’re never exactly equal.
The only way to know is to test it, and to do that, you need to roll dice in bulk. Ten dice aren’t enough. Hundreds is needed before you can feel comfortable about anything. That’s where simulation comes in: it lets you see thousands of theoretical rolls instantly, showing the signal buried within the noise.
In the end, knowing those percentages makes all the difference. It forces you to make calculated bets rather than guessing during a game. You’ll take a loadout with a fifty-one percent probability if you’re certain. You’ll hold back from one with a forty-five percent shot. Having that clarity allows luck to become something that’s within your grasp. You’re no longer in control of what happens, but you are in control of the factors that contribute to it.