League Table Calculator
Estimate league points, rank pressure, points percentage, and tiebreak strength from a team or player's record, scoring system, differential, penalties, and remaining matches.
Full breakdown
Pts
Wins x win value + draws x draw value + losses x loss value
Adj
Penalties reduce points; head-to-head can add a close-table edge
%
Current points divided by points available from games played
Rank
Projection blends points pace, table size, format, and tiebreaks
| Scoring system | Win | Draw | Loss | Common table use |
|---|---|---|---|---|
| Football 3-1-0 | 3 | 1 | 0 | Association football, many group stages, league ladders |
| Classic 2-1-0 | 2 | 1 | 0 | Chess round robins, some tabletop leagues, short match tables |
| Win-loss only | 1 | 0 | 0 | Head-to-head series where draws are impossible or ignored |
| Set-point league | 3 | 0 | 0 | Volleyball, table tennis, or esports tables with differential tiebreaks |
Use the same point values as the official table before comparing ranks across teams.
| Points percentage band | Typical position signal | Rank estimate effect | Watch item |
|---|---|---|---|
| 75% and above | Title, top seed, or promotion pace | Strong pull toward the top 10% of the table | Small tiebreak losses can still matter in tight races |
| 60% to 74.9% | Playoff or upper-table pace | Usually above the table midpoint | Remaining matches decide whether pace is secure |
| 40% to 59.9% | Mid-table or qualification bubble | Rank is sensitive to differential and head-to-head | One result swing can move several places |
| Below 40% | Lower-table or elimination pressure | Projected rank falls toward the bottom third | Games in hand can still create recovery paths |
| Tiebreak layer | What to enter | Calculator role | Best for |
|---|---|---|---|
| Goal, game, or set differential | For minus against | Primary tiebreak weight in the score | Sports leagues, set leagues, esports maps |
| Secondary tiebreak score | Buchholz, points scored, sets won, or custom metric | Moderate extra rank pressure | Chess, Swiss events, multi-game tables |
| Head-to-head bonus | Positive for advantage, negative for disadvantage | Close-table adjustment after points pace | Mini-leagues, tied records, playoff bubbles |
| Penalty points | Deducted points as a positive number | Subtracted before percentage and projection | Administrative deductions or forfeit penalties |
| Format | Typical size | Main ranking metric | Calculator setting |
|---|---|---|---|
| Standard league | 8 to 24 teams | Total points, then differential | Standard league table |
| Round robin | 4 to 16 players | Match points, Sonneborn or head-to-head | Round robin standings |
| Group stage | 4 to 8 teams per group | Points, head-to-head, differential | Group stage table |
| Swiss qualifier | 8 to 40 players | Points, Buchholz, opponent score | Swiss-system qualifier |
If you’re three points adrift with five games to go, it feels as though that’s quite a margin, yet sometimes it tricks you into thinking something different. While the points total are a good indicator of how well you’ve done, it doesn’t take account of what happens in future matches… Nor does it include tiebreakers. That’s why a dynamic calculator can be more helpful than a static standings sheet.
Because the former takes account of your future fixtures, the one above project points, helping you determine whether the gap is narrowing or increasing. The total points number is what most folks see and stop there; they should of care about context that goes beyond just the number. Fifty points in an eight-team league could mean you’re competing for promotion; fifty points in a twenty-team league puts you scrapping against relegation.
Why Points Are Not Enough
The calculator seeks information about how many team you’re competing among. That alters the aggressiveness required to scrape out points necessary to remain ahead of the drop zone or to push up into contention for one of the upper place. Your point count on your scorecard needs to be viewed in light of where you sit in entire field.
The beauty of this scoring is that each format and sport can have its own way of awarding points. In football, winning are worth three points, which is a large reward compared too the old two-point system. For chess (and other tabletop leagues), wins is typically awarded two points and draws are one point. If you input the wrong number, it’s all meaningless when you calculate your percentage. You’ll need to be able to adjust weights on the calculator to match your own league’s points system. This matters because a high points percentage in a low-stakes scoring system might actualy indicate mediocrity when translated to a higher-variance format.
When two team are tied, it comes down to tiebreakers. These include goal difference, head-to-head records, and something called Buchholz scores. They don’t matter most of the time; not for 99% of fans; but they’ll be deciding who makes the playoffs on the last day. Keep ‘em in mind all year long. Having a plus-goal-difference provides a buffer in case things go south at the tail-end of the season. That’s a real measure of “advantage” that’s baked into tiebreak score (you’ll see what I mean once we get there). It makes the otherwise confusing rule come alive.
Penalties: These are another layer that people often mess up. For instance, if your league takes points off for forfeit or some other administrative thing, enter it right away as a positive number into the penalty field so it will subtracts it from your total prior to running the projection. That way your percentage is correct. Otherwise, you could feel good about yourself while you hover on the bubble of elimination.
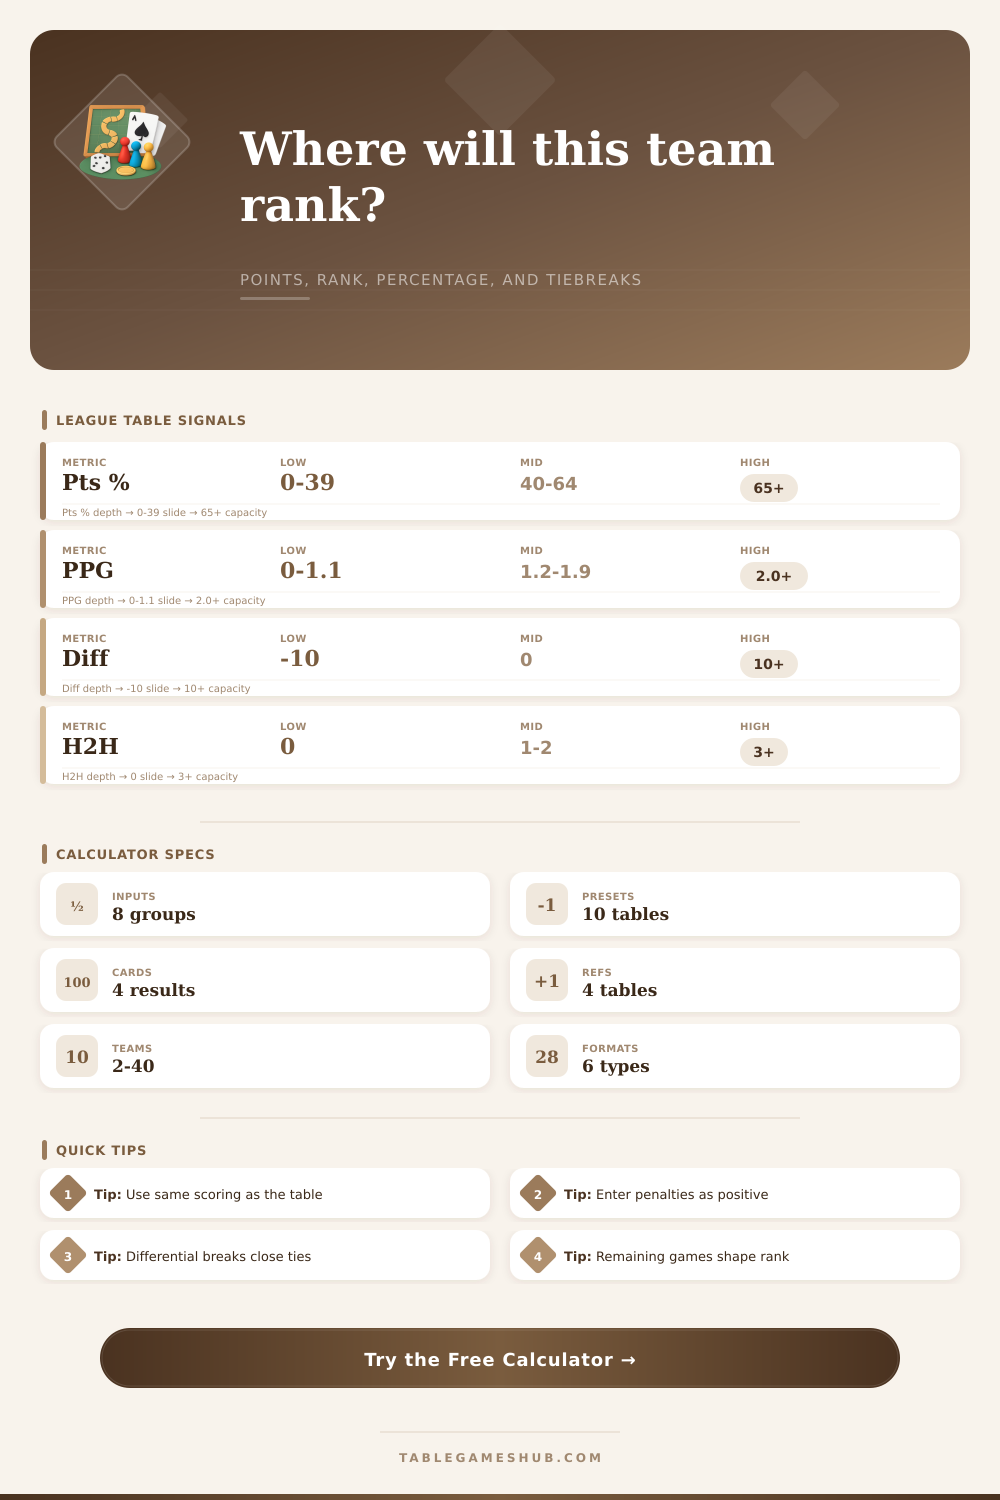
Perhaps most telling of all is its points percentage output. This takes into account the number of points that you already own out of total possible. If you’re above 75% then you’re typically in title contention or at least have good qualification hopes. Below 40% and it doesn’t matter who’s coming up next, you’re likely in trouble. The page breaks this down further with reference tables which explain exactly what each percentage correspond to in terms of your rank estimate. It removes the noise and lets you see raw efficiency.
To get an idea of what happened, you have to consider more than the score. Understand the game’s points system. Factor in the tiebreakers. Look ahead. That’s exactly what the calculator here will do for you: combine all those factors into one easy-to-understand prediction. It is not the future itself, but it takes the guesswork out of preparing for it.
If you’re competing in a fantasy league, leading a local group or simply wondering why your beloved team isn’t dominating, let the math show you what your eyes can’t see. The math might not match what is on the scoreboard, but the numbers never lie.