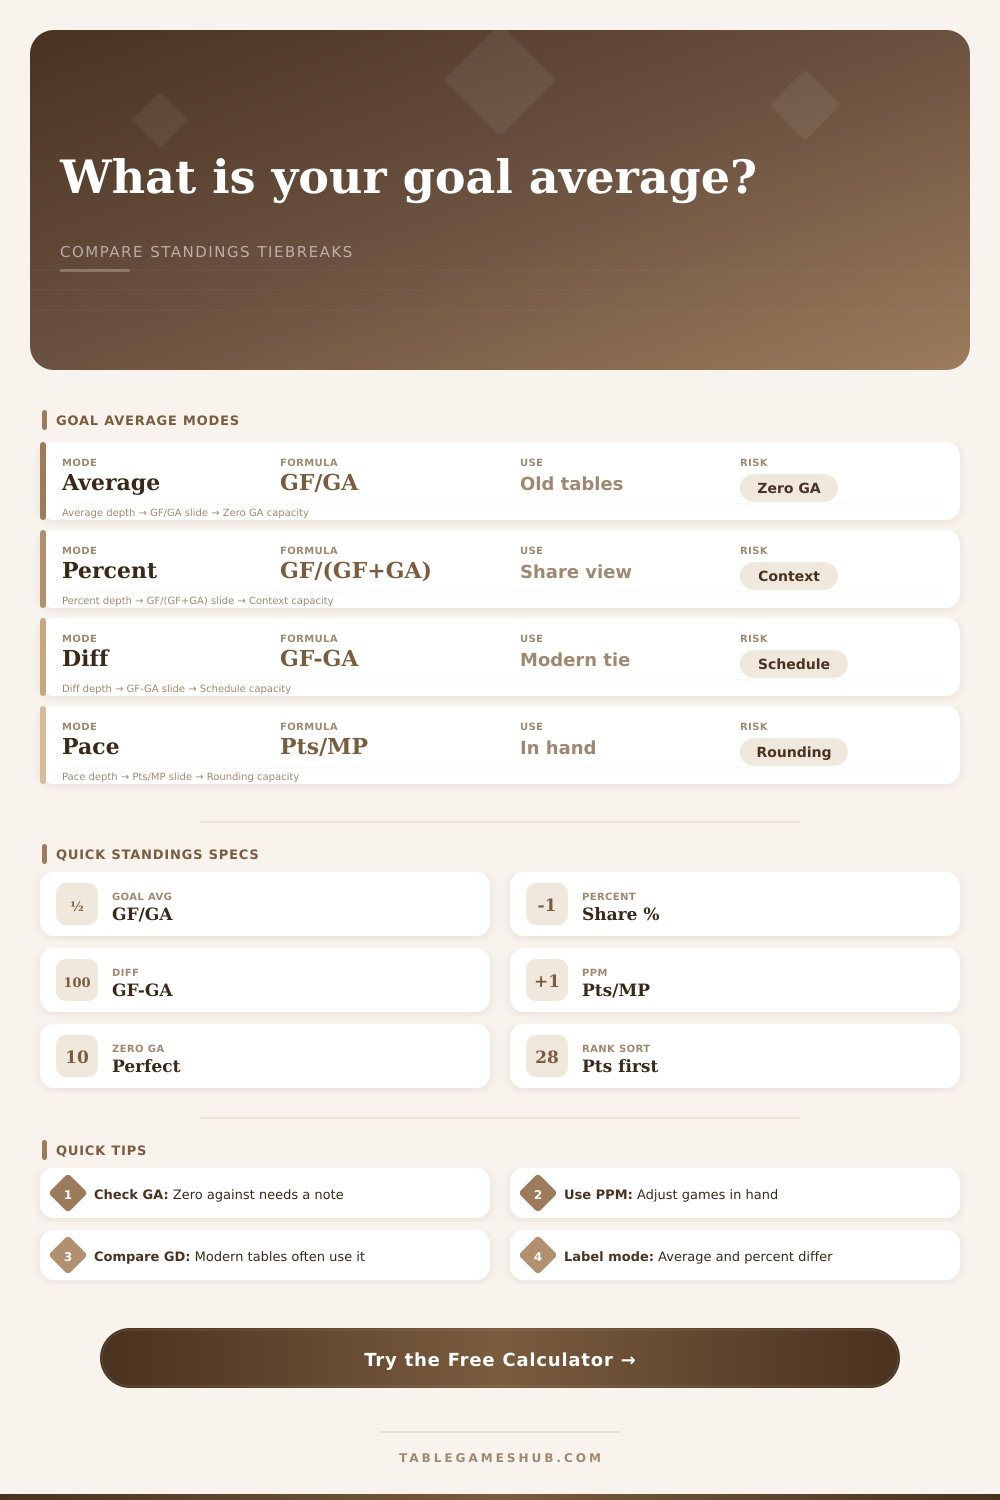
Goal Average Calculator
Calculate standings goal average, goal percentage, goal difference, points pace, historical tiebreak notes, and rank comparison against nearby teams.
| Mode | Formula | What it rewards | Logistics note |
|---|---|---|---|
| Goal average ratio | Goals for / goals against | Scoring efficiency relative to concessions. | Needs a written rule for teams with zero goals against. |
| Goal percentage | Goals for / total goals | Share of all goals in the team's matches. | Same ordering as average when both sides have goals against. |
| Goal difference | Goals for - goals against | Net scoring margin over the schedule. | Common modern tiebreak before goals scored. |
| Points pace | Points / matches played | Table position adjusted for games in hand. | Use as a projection aid, not a final table rule unless specified. |
| Rule order | First sort | Second sort | When to use |
|---|---|---|---|
| Points, then average | Standings points | Goal average ratio | Historical football tables and older league records. |
| Points, then difference | Standings points | Goal difference | Most modern association football style tables. |
| Pure average | Goal average ratio | Goal difference | Quick ratio audit without points priority. |
| Goal percentage view | Goal percentage | Goal difference | Useful for sports or archives listing percentage instead of ratio. |
| Check | Calculator field | Expected relationship | Review action |
|---|---|---|---|
| Goals ledger | GF and GA | Goal difference equals GF minus GA. | Match the official standings column before comparing ranks. |
| Games in hand | Matches played | Points pace changes when teams have unequal matches. | Use PPM projection beside, not instead of, the official table. |
| Zero conceded | Goals against | Goal average becomes perfect or undefined. | Apply the competition's stated zero-GA convention. |
| Equal points | Current points | Tiebreak columns decide the rank order. | Confirm whether average or difference is the next sort. |
| Archive comparison | Ranking mode | Old tables may not use modern tiebreaks. | Label historical goal average separately from GD. |
| Preset | Sport table style | Why it is useful | Watch item |
|---|---|---|---|
| Old First Division | Football archive | Shows a points tie decided by goal average. | Do not replace it with modern GD by accident. |
| Hockey Pool | Group table | Separates goals-for pressure from ratio ranking. | High scoring can hide poor concessions. |
| Youth Soccer | Short league | Highlights how one lopsided score changes average. | Small match counts are volatile. |
| Futsal Round Robin | High event totals | Compares average and percentage on busy scorelines. | Check all group matches are included. |
| Games in Hand | Uneven table | Adds points pace beside the live ranking. | Projection is not an official rank. |
The issue arises when you attempt to rank things in a table. Twenty games played and two team are tied on points. The spreadsheet isn’t just counting wins and losses anymore, it’s a philosophical argument. Should the one with the most goals go top? Or perhaps it is the one with the best defence.
That’s where the calculator does its work. It crunches the numbers for you. But what do those numbers mean? Why should they matter? Why does that data matter?
Why Goal Difference Matters
In football, they used to break a tie by averaging goals. This means you looked at how many goals your team scored compared to how many goals they give up. In practice it was simple and elegant. It meant being efficient got rewarded. If one team scores twelve and concedes six, then its goal average is two. If another team scores twenty-four but concedes twelve, well its goal average are also two. By this math, a high-scoring offensive juggernaut and a disciplined defensive master was treated as equals, provided their balance remained identical. This was true as long as those numbers balanced out.
But there was a flaw in the logic. And that flaw came into focus when teams continued to post shutouts. Zero goals against, that’s a division-by-zero error. It created an infinite number of averages. And leagues were forced to create makeshift rules for dealing with such perfect defense teams. They often awarded a huge bonus and declared those team the best by decree. That led to inconsistency. And that drove purists crazy, and it boggled casual fans.
But then, that’s why we have goal difference these days: the moddern move to base things on certainties. Goals for minus goals against. That puts it on a margin. The fact that you’re two goals ahead is more significant than the ratio of your total score to theirs. A score of fifty for and thirty against is obviously better then forty to twenty. Even if old method said something different.
This allows you to switch between current and historical styles on the page. It is useful for checking past records, allows you to see how a modern-day race would change with the rules. Input stats for your team. Then, you’re selecting an angle to evaluate performance.
The interface includes a reference table of formula breakdown. It includes point pace, goal percentage, and more. Different measures of team stability. A goal percentage shows the share of total goals involved in a match that your team scored. This gives a better sense off the context. Sometimes the raw numbers don’t give you that picture. This is especially true in high scoring sports. Handball, futsal are examples where there is lots of play and it throws off traditional ratios. Including points per game makes the current picture clearer. It extends current output across an entire season’s duration. That takes into account games in hand. That’s key when there’s an unbalanced schedule. Perhaps one side has already played three extra matches compared to its competitor? Without the adjustment, the table would give a false idea of competitive balance.
The calculator makes those adjustments, too. For each team it calculate how many points they’re generating every match, an efficiency rate per game. You’ll be able to spot which team is out-performing the other over time. It’s not just about who’s leading right now but who is actualy performing better over time.
The thing about these numbers; the thing that no software can ever compute, really, it has some psychology to it. And fans tend to give an emotional value to a large win. Fans think that a large win should of matter more. But the math doesn’t care. Ten 1-0 wins are worth the same as one 10-0 win. That’s how goal difference works, too. That neutral nature is what makes it work. The storylines never match up statistically. Keep that in mind when running your team. Analyze a league? Keep this in mind, too. It’s about understanding what is going on under the hood.
Yes, you’d like to know where you rank now. These are the tools. And they take the noise out of it. They present you with raw data. These raw numbers enable you to make a decision based off fact. Not your feelings. Perhaps you like the old-fashioned beauty of goal average? Maybe the new-fangled clarity of goal difference? It doesn’t matter. You just want to know who really should be at the top.