D100 Probability Calculator
Model percentile dice checks for roll-under skills, roll-over difficulties, exact values, target bands, opposed d100 contests, modifiers, rerolls, and best-or-worst roll methods.
①Scenario Presets
Load a real tabletop percentile situation, then tune the fields for your table.
②D100 Inputs
③D100 Component Grid
④Method Comparison Grid
| Method | Best Use | Formula Base | Table Effect |
|---|---|---|---|
| Roll under or equal | Skill percentage checks | Target / 100 | Higher target improves odds |
| Roll over or equal | Difficulty number checks | (101 - Target) / 100 | Higher target lowers odds |
| Inclusive band | Random tables and event ranges | (High - Low + 1) / 100 | Wider bands are more likely |
| Opposed contest | Two characters rolling skills | Enumerates 10,000 roll pairs | Handles ties and both-fail cases |
⑤Reference Tables
| Target | Roll Under | Roll Over | Failure Under |
|---|---|---|---|
| 25 | 25% | 76% | 75% |
| 40 | 40% | 61% | 60% |
| 55 | 55% | 46% | 45% |
| 70 | 70% | 31% | 30% |
| 85 | 85% | 16% | 15% |
| Base Chance | One Reroll | Two Rerolls | Three Attempts |
|---|---|---|---|
| 30% | 51.0% | 65.7% | 65.7% |
| 45% | 69.8% | 83.4% | 83.4% |
| 60% | 84.0% | 93.6% | 93.6% |
| 75% | 93.8% | 98.4% | 98.4% |
| Band | Included Rolls | Chance | Example Use |
|---|---|---|---|
| 01-05 | 5 | 5% | Critical result |
| 06-20 | 15 | 15% | Rare event |
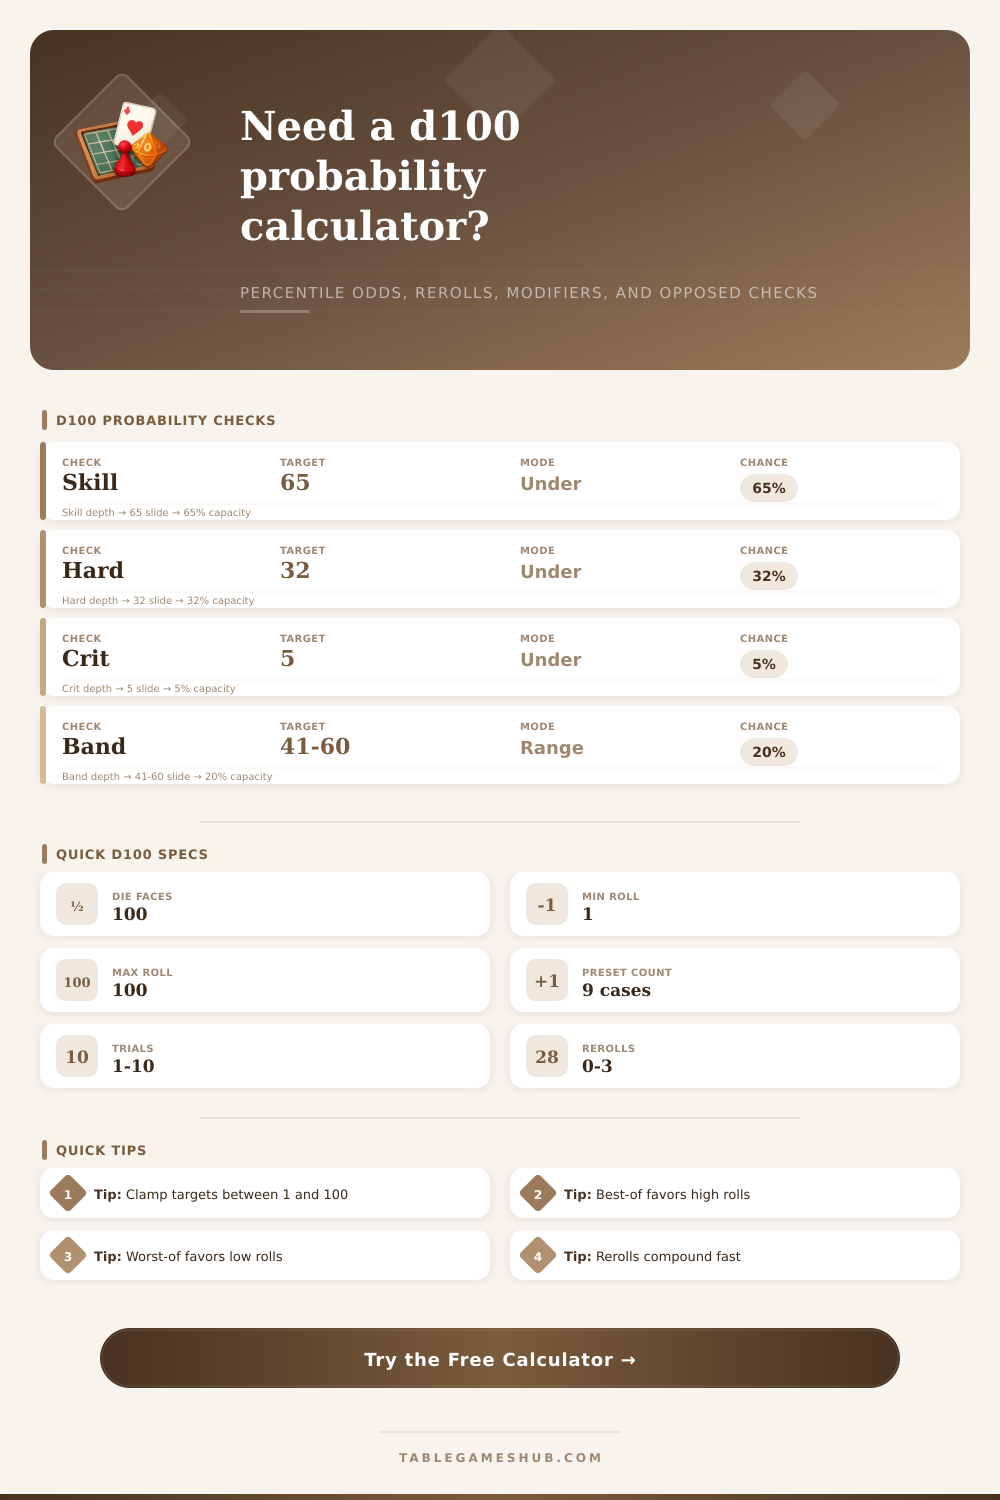
| 41-60 | 20 | 20% | Table entry |
| 76-100 | 25 | 25% | High outcome |
| Roll Method | 45% Base | 65% Base | Notes |
|---|---|---|---|
| Single d100 | 45.0% | 65.0% | Plain percentile roll |
| Best of 2 high target | 69.8% | 87.8% | Helpful for roll-over goals |
| Worst of 2 low target | 20.3% | 42.3% | Harsh for roll-under goals |
| At least once in 3 | 83.4% | 95.7% | Independent attempts |
⑥Probability Tips
Target clarity: Decide whether a modifier changes the target number or the die roll before calculating. This tool applies it to the target.
Opposed checks: Percentile contests can swing on tie rules. Use the tie selector to match your table before trusting the final chance.
Each percentile roll has its own sort of tension. One number determine whether you succeed or fail, and success hangs upon the position of two dice against that number. Add some mechanics, however, and all goes pear-shaped. Arithmetic replace intuition then. Players intuitively assume their skill percentage as a permanent fact, yet the second you add anything to that. Band results, rerolls, opposed checks, ground changes beneath them.
That’s where this tool comes in: it charts those changes so your narrative doesn’t get derailed. That’s the basic trick. Your target is there. Roll under it. If your skill are sixty-five, then you make any roll between one and sixty-five. This changes when you throw in modifiers. Say DM gives you a ten percent bonus. Does that mean you now need to roll under seventy-five? Sure, if that’s how the system works. Except what happens if you’re already at ninety-eight percent? You can’t go above a hundred. So the bonus goes poof! Nothing.
How This Tool Helps You Play Better
That’s the danger with high skills in percentile systems. Near the upper end of the curve, law of diminishing returns kicks in hard. When you’re failing at a rate of twenty percent, then a ten percent increase makes all the difference. When you’ve got it down as an expert at ninety-nine percent, a ten percent boost doesn’t do a damn thing for you. That leaves you with a strategic choice when building characters: Do you try to maintain everything in the middle, where even small increases is helpful? Or do you go heavy on specialization, knowing that any further increase is wasted effort because you’re already as good as it gets?
The calculator gives you insight into this tradeoff. With each adjustment you make to a target or a modifier, you’ll see exactly how much more likely you become to succeed (in percent terms) per additional modifier point across various skill levels. This shows you the unseen price of going all-in. But things get interesting once you bring in repeated attempts.
Most games let you try again if you fail, or let players take several different tests in order to accomplish some difficult objective. That flips the whole thing around; instead of taking one shot at a given probability, it become a cumulative probability. Now, maybe your chances were 30% on any given shot. Those don’t sound good. But now you’ve got two rerolls? Now you’re not thinking about “what’s my 30% chance.” You’re thinking about “what’s my chance that I fail three times in a row?” As those tables on the page demonstrate, your failure probabilities plummet rapidly as the number of attempts rise. With enough tries, even a mediocre skill can be incredibly reliable.
Another wrinkle to this is opposed checks, which involve two separate probability distributions meeting with each other. In a contest between your character and some foe, you’re not rolling against a fixed value, you’re rolling against another random result from another player. That’s why the tool runs through all ten-thousand possibilities of the combination of both rolls to determine actual win rate. And that’s important. Folks might be surprised by how frequently ties occur. What your group does when someone rolls a tie have a huge impact on the likelihood of winning or losing. Your effective chance of success goes down if ties go to the defender. You also want to see what it means in practice if result is a split.
Another area of potential confusion are band results. Rather than pass/fail, this could mean rolling for something like a table of encounters where the result hinges on whether you succeed by landing between forty-one and sixty. That’s a smaller range of success as compared to simply rolling under, and it’s not enough to know only what’s at the middle; it matters how wide the band is. Naturaly, the wider it is, the better and more likely it becomes. Being aware of this… Knowing that a band of twenty points will have a one-in-five shot of happening if you’re building a random event table; can help you weight your own expectations for the narrative outcome.
The bottom line, though, is that this isn’t spreadsheet math at the expense of fun. It’s a way of seeing the risks involved in order to make more informed choices at the table. With your best-of-two plan, you now know it improves your chances by almost a fifth, you can go all-in on daring plays with confidence. Knowing that higher skills don’t provide as much return as lower ones lets you spend points more wisely when building characters. The dice will always be wild cards, but they have defined probabilities, and once you understand the numbers, the suspense of the die becomes less fear than eager waiting for fate to unfold.
You’ve got the numbers, which helps you understand the risk so you can make better decisions. You should of known that!