Set Win Percentage Calculator
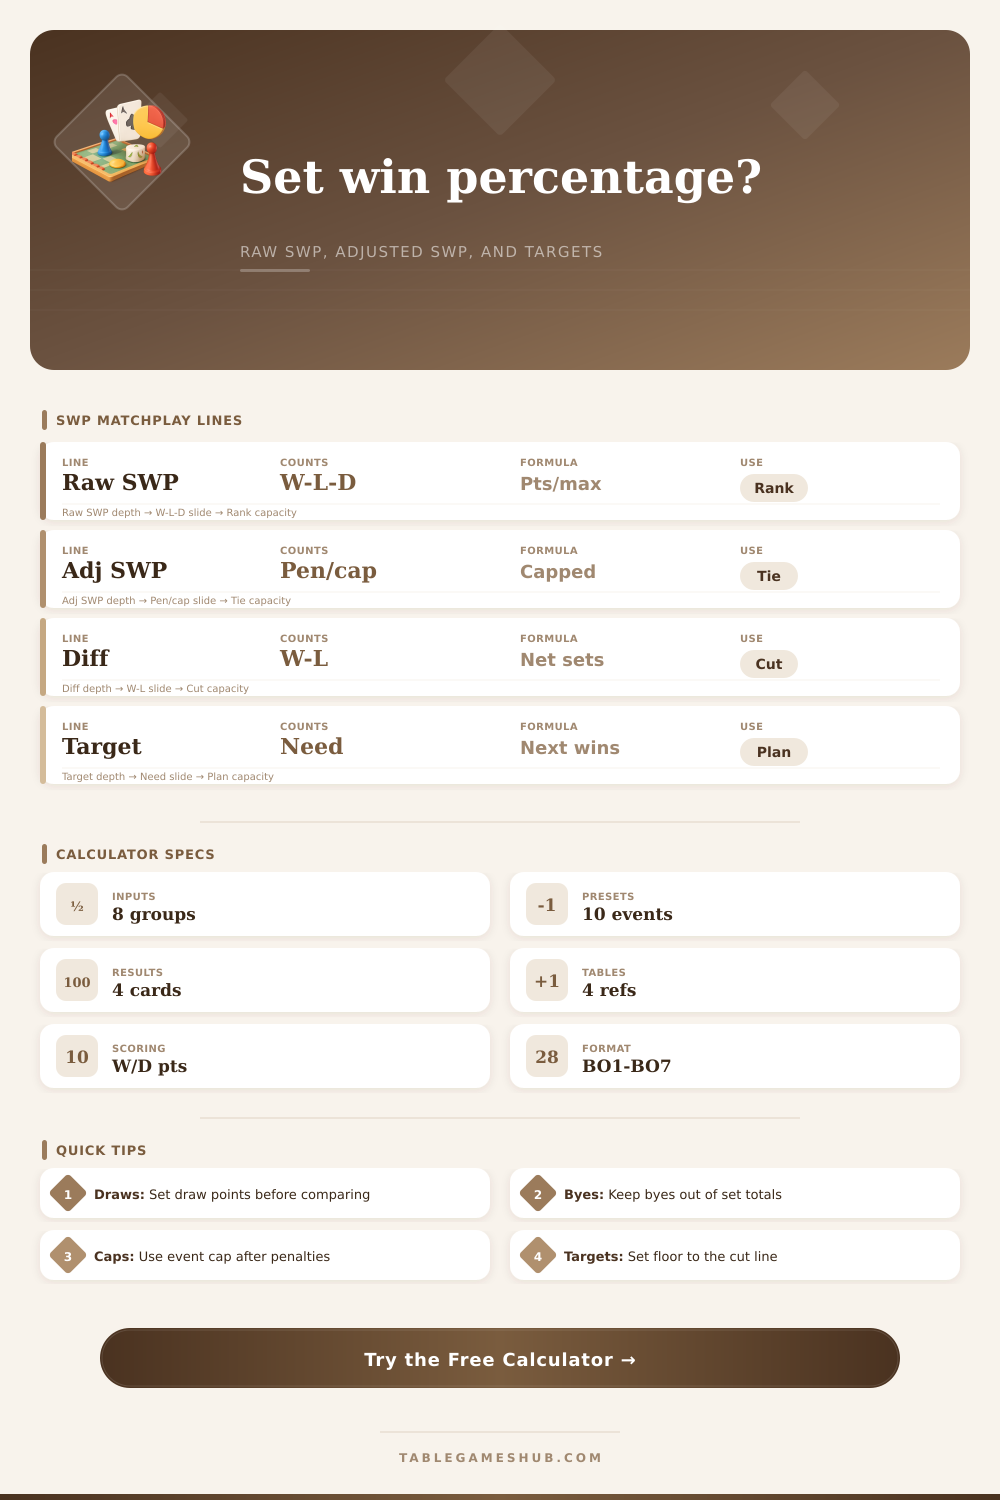
Calculate raw SWP, adjusted SWP, set differential, and the target wins needed for matchplay standings, Swiss cuts, ladder tables, and team event reports.
Best-of format capacity
| Format | Maximum sets | Common event use | SWP note |
|---|---|---|---|
| Best of 1 | 1 per match | Large Swiss, quick ladders | Every set equals the match result. |
| Best of 3 | 3 per match | Most tabletop matchplay | 2-0 and 2-1 wins separate tiebreaks. |
| Best of 5 | 5 per match | Finals, playoffs, league nights | More room for set differential swings. |
| Best of 7 | 7 per match | Series play and championship tables | Target math should use remaining set slots. |
Common set scoring policies
| Policy | Win points | Draw points | When to use |
|---|---|---|---|
| Pure percentage | 1 | 0.5 | Default when drawn sets split credit. |
| No-draw event | 1 | 0 | Use when all unfinished sets are losses or ignored. |
| Table points | 3 | 1 | Mirrors match-point style standings. |
| Half-credit draw | 2 | 1 | Equivalent to 1 and 0.5, easier to audit. |
Typical cut-line targets
| Event stage | Floor | Cap | Practical reading |
|---|---|---|---|
| Early Swiss | 55% | 100% | Useful for spotting players above pace. |
| Bubble round | 60% | 100% | Common target for a comfortable cut race. |
| Top table | 67% | 100% | Strong tiebreak for undefeated or one-loss players. |
| Capped report | 50% | 90% | Useful when event rules limit maximum tiebreaks. |
Bye and unfinished treatment
| Situation | Count as won? | Count in denominator? | Recommended input |
|---|---|---|---|
| Round bye | No | No | Add to byes only. |
| Intentional draw set | No | Yes | Add to sets drawn. |
| Incomplete timed set | No | Usually yes | Add to unfinished if event counts it. |
| Penalty downgrade | No | Yes | Add penalty sets. |
Match wins tell you less about your performance then set win percentage does. On a score sheet, you see which team earned more sets but many times it’s a closer call than final score lets on. Your set win percentage clears the noise. It’s what tells you if you’re actualy good or just had a few lucky breaks along the way. Does your success come from actual skill or being in a good draw? That’s answered by set win percentage. Once you input your record into page, calculator does the rest.
Now you have to know what makes numbers change like they do. Raw set win percentage is simply number of sets won divided by total sets played. Seems simple enough until you realize that there are such things as penalty sets and draws. Penalty sets occurs more frequently than most casual players expect. Draw sets split credit and typically result in half a point. Draws and penalties subtracts from the maximum score possible.
Why Set Win Percentage Matters
Why does this matter? Two player may both have the same record but wildly different performances in sets. One player could be crushing everyone in each game and coasting into easy victories, where their inflated win totals do not reflect their limit. Meanwhile, another player might lose set but barely scrape by in tiebreakers, obscuring any real weaknesses. The raw score reflect this disparity immediately.
Consider caps and penalties: Most events will have a floor/ceiling on their point total so that the results aren’t skewed by an outlier; if your percentage of wins is capped then we’ll trim it back to the max allowable. That helps avoid stats quirks, but also means a blowout won’t necessarily appear as strong in print as it felt during competition. Know the cap prior to setting your targets. Those can vary based off stage of event, which is displayed in reference table on the page. Final tables requires better accuracy than early swiss rounds.
The next level to look at is set differential. This compares wins directly against losses, without taking draws into account. This is a net number. You can have a slightly lower percent but still have high set differential. This would mean that you were dominating a match. If you have negative differentials, this means you’re struggling in general regardless of whether you managed to win the match. It’s hard to be faking having a good set differential over the field as a whole since you need to be winning more sets then you lose.
The best use of this metric (and any of these) is in planning ahead. What’s the minimum number of sets you can lose and still make it? Anxiety becomes arithmetic. No longer do you worry about “if I’m good enough”… Just plug numbers in and see what needs to happen in upcoming round. It takes away the stress of playing because now there is something measurable and actionable, the game has a clear outcome instead of an unclear direction. You can tell if you’re screwed after one poor set, or if all hope isn’t lost yet. Your remaining time and type of format used determine your targets and show you exactly where to go from here.
For example, many players include byes when calculating their percentages. This artificialy inflates their percentages. A bye is neither a win nor a missed opportunity. It’s neutral; it should of never be included in the denominator if you want an honest metric. You can take credit for showing up but to count that as a win is treating a bye as a win. Sounds good until you check how you did with real livig competition. Keep your byes separate and your set win percentage will reflect only the games you’ve contested.
How does this impact your numbers? The best-of format has a huge impact on that. Your percentage changes wildly from day to day based on a few bad sets in short matches. One mistake can tank your percentage overnight. Long series smooth out that variance and give you room to recover if things go badly; your consistency starts to shine through there too. Knowing what kind of match you’re playing will help you understand if that drop in performance is cause for concern or simply within the expected noise.
In the end, the truth is shown by set win percentage. It exposes the gap between process and results by showing who won by being good and who won by getting lucky. If you track it correctly, soon enough you’ll find patterns in how you play that you never saw in your record. Maybe you get gassed later in a game, or maybe you have trouble beating certain types of opponents. That’s where you improve much faster then if you just tally up wins. The score sheet will try and hide what happened but the math doesn’t lie.