Expected Score Calculator
Estimate an Elo-style expected score from player rating, opponent rating, rating difference, draw odds, game count, scoring system, and K weight.
| Rating diff | Expected share | Expected points | Read |
|---|
| System | Win | Draw | Best use |
|---|---|---|---|
| Classic game score | 1 | 0.5 | Chess, Go match sheets, most Elo lists |
| Match points | 3 | 1 | League tables where wins are rewarded heavily |
| Board points | 2 | 1 | Team boards with paired point scoring |
| Binary match | 1 | 0 | Games where drawn boards are ignored or replayed |
| Draw odds | Typical table | Win split effect | Note |
|---|---|---|---|
| 0-5% | Decisive dice/card game | Mostly win/loss | Expected share almost equals win odds. |
| 10-25% | Word or abstract ladder | Small draw middle | Useful for short match forecasts. |
| 25-45% | Club chess or team board | Wide draw middle | Wins and losses compress around draws. |
| 45-70% | High-draw rating pool | Narrow decisive tail | Rating swing depends heavily on decisive games. |
| K weight | Rating pool | 1 point over | Use carefully when |
|---|---|---|---|
| 8-12 | Established master pool | +8 to +12 | Samples are stable and ratings are mature. |
| 16-24 | Club or league pool | +16 to +24 | Most adult club forecasts live here. |
| 25-40 | Provisional list | +25 to +40 | New players need faster rating movement. |
| 40-80 | Fast online pool | +40 to +80 | Short formats can be noisy. |
The board’s in front of you. Your opponent sits opposite you. You look around and try to figure out if you will win or lose. Is it luck? Is it skill? Is it nerve? It is a combination of all three.
There’s something going on beneath the surface: a quiet mathematics. It converts our human uncertainties into numbers that let us predict the outcome before the first move are made. That’s what rating systems does.
How Rating Systems Work
This page has one, the expected score calculator; which does it for you. It translates your raw ratings into point predictions and probabilities. Apply standard Elo reasoning to any game you play and take the guesswork out of pre-match analysis.
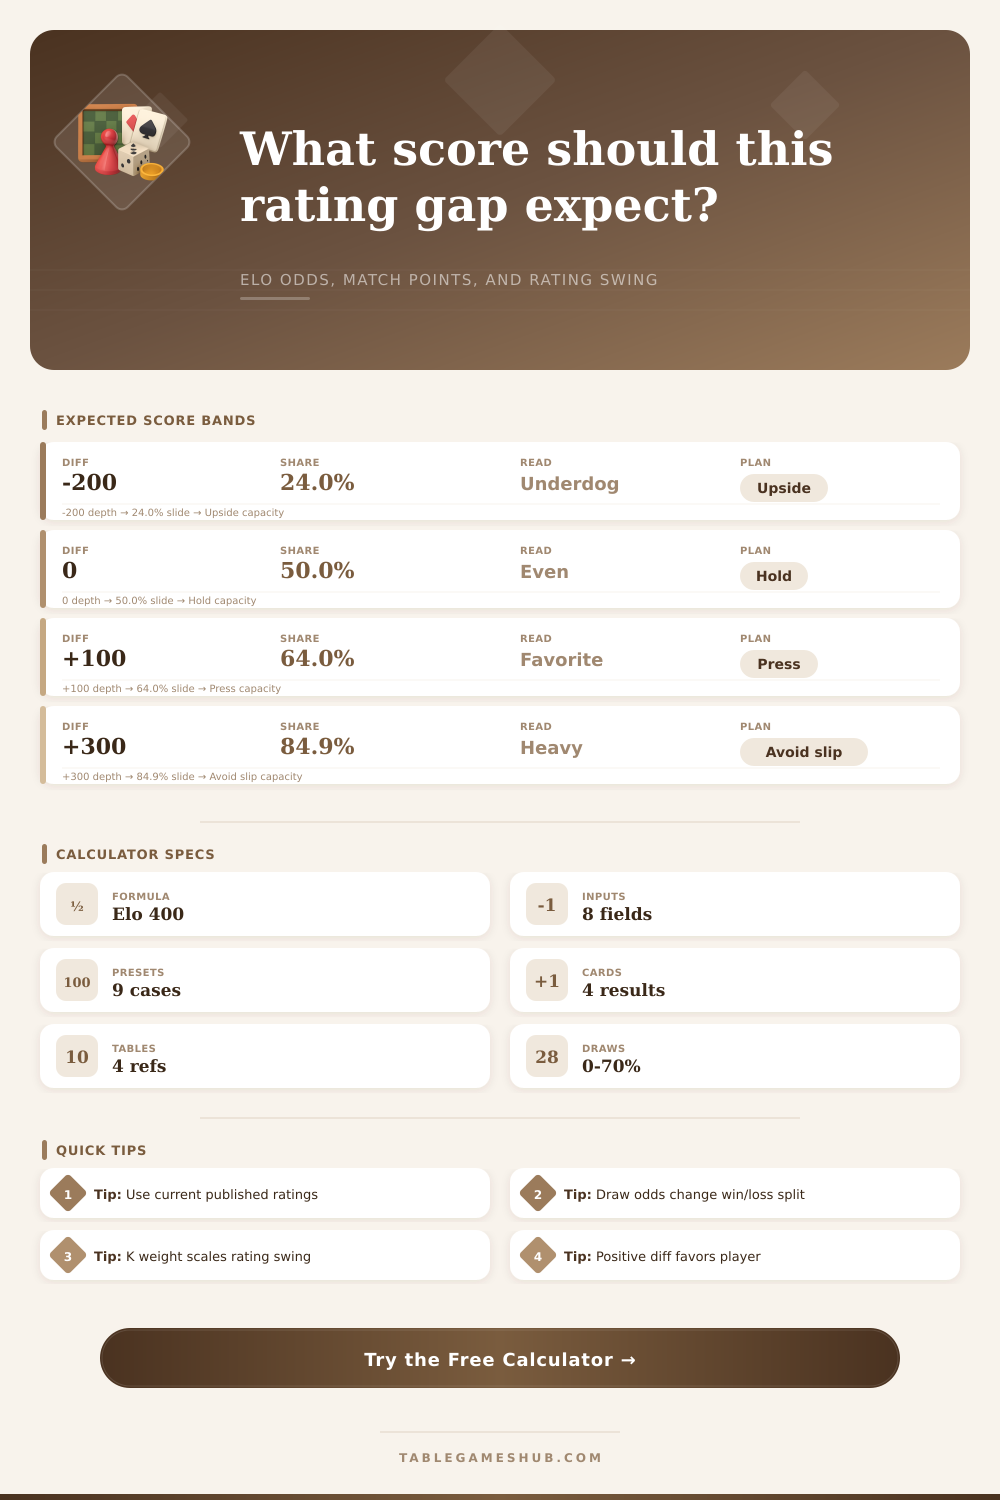
The basic idea is that the curve is very simple, but it works at the heart of everything. When the ratings is equal (zero points apart), then there’s a 50% chance for each player to take the whole point. Why does this make sense? Because if both players are evenly matched, they will split every match in the long term.
But as the difference between the players increases, the probabilities becomes starker. Usually a two hundred point disparity will result in roughly a 24% expected score for the underdog. Sounds generous, right? Except that when people play chess, upsets occur less frequent than we intuitively think.
To find out precisely what your expected score will be given your rating and theirs: plug their number into the box, and yours, and see just how far down the curve you fall. The calculator handles all the dividing and exponentiating for you, so you don’t have to remember the formula.
Even more important is how you count points. In chess, a win counts 1 point and a draw counts 0.5. Some other games weight differently. A soccer game might give 3 points to a win and 1 point to a tie. That changes expectations alot. The calculator accounts for this as well by allowing you to choose the scoring system used.
So if you’re in a win heavy league, your projected score will appear larger then if you were competing in a binary win-loss game. But your real chance at victory remains unchanged. It’s a subtle thing but it can help ensure you don’t misjudge what your target should of be if you compare results between different rulesets.
It gets trickier with draws. Draws don’t happen often in quick blitz games online. Here, your expectation is nearly all wins and losses. However, when playing slow classical chess or a team board game where each match consist of multiple rounds, the draw percentage might be 30-40%.
For this reason the calculator asks you to guess how frequently you think you’ll draw. Based off that guess it divides up the expected points between wins, draws and losses. If you guess a high draw percentage, then it will lower the win (and loss) chances accordingly. But it maintains the total expected score. That’s important when planning out tournaments. You may know you’re going to draw most matches and thus have time and energy to budget over the course of a multi-round event.
The other part of that equation is the ratings change. That’s where the K weight comes in. It shows what change happens to your rating based on every result. Higher K = volatile. That’s why it’s normal for those starting out (provisional) or people on the list who just joined (new). Lower K = stable, since one loss doesn’t send someone into a tailspin.
Depending upon if your outcome was better than or worse than expected, the calculator will show what your rating change might be. So sometimes even if you’re favored and draw against someone you were meant to beat, you might get a small dip in rating. Why? Because you didn’t lose, but you weren’t supposed to draw. Understanding how ratings swing helps you manage the emotional rollercoaster of being competitive.
You can see the reference tables here which show what would happen with different K weights in different rating pool. These ratings are a snapshot of historical results; they’re useful only as a guide. They don’t predict future greatness. “Players can be injured. Players can be out of practice. Some days players just get cold.” Statistically, this is your starting point.
But remember there are also human factors. Mood, injury, preparation, and fatigue still matter in any game. Use the presets to create a scenario. Perhaps it’s a handicap game or one where you face a team match board. How do those conditions change your odds? Model those realistic scenarios and get a feel for what makes a difference. It puts the abstract anxieties into real data.
Just know this: Expectations are only a place to begin when it’s time to compete. The beauty of competition is that anybody can beat anybody on any given day. However, understanding your mathematical edge will allow you to trust the math and the process. You won’t have to worry about it. Just focus on execution.