Bowling 300 Game Probability Calculator
Bowling 300 Game Probability Calculator
Estimate the odds of rolling 12 straight strikes, compare an independent model with a pressure-adjusted model, and scale the chance across attempts, sessions, leagues, and seasons.
Use your first-ball strike percentage as the base input. A perfect 300 game needs strikes on the first nine frames plus all three balls in the 10th frame, so the model multiplies 12 required strike events.
1Scenario presets
2Inputs
Use first-ball strike rate. In frames 1-9 this is the frame strike probability.
Independent keeps every required strike at the same probability.
A value of 8 means shots 9-12 may be adjusted.
Compounds across the closing shots, not just the final ball.
Applied to strike balls 10, 11, and 12.
Used by the hybrid model to soften every later shot.
Attempts needed answers: how many games until this confidence is reached?
Typical league set is 3 games; tournaments may be higher.
League/session odds scale by total games thrown by the group.
Used for season odds and expected perfect games.
Perfect game probability results
Independent 12-strike odds
0.000%
Same probability for all 12 shots
Modeled 300 odds
0.000%
Pressure-adjusted sequence
Attempts needed
0
For target confidence
League/session odds
0.000%
All bowlers, one session
Calculation breakdown
3Perfect game model grid
12
Required strikes
Nine opening frame strikes plus three 10th-frame balls.
p^12
Independent odds
Baseline formula when every strike ball has the same chance.
prod p
Adjusted odds
Pressure model multiplies each shot's adjusted probability.
1-(1-p)^n
Attempt odds
Scales one-game chance across sessions and seasons.
4Dynamic probability tables
Shot-by-shot strike probability
| Strike ball | Frame context | Independent chance | Modeled chance | Running 300 chance |
|---|---|---|---|---|
| 1 | Frame 1 | 55.0% | 55.0% | 55.0000% |
Attempt, session, and league odds
| Scale | Total games | Chance of at least one 300 | Expected 300s | Plain-English read |
|---|---|---|---|---|
| Single game | 1 | 0.0000% | 0.0000 | Calculate to update |
Strike-count distribution for one game
| Outcome band | Meaning | Independent chance | Modeled chance | Use case |
|---|---|---|---|---|
| 12 strikes | Perfect game | 0.0000% | 0.0000% | Main result |
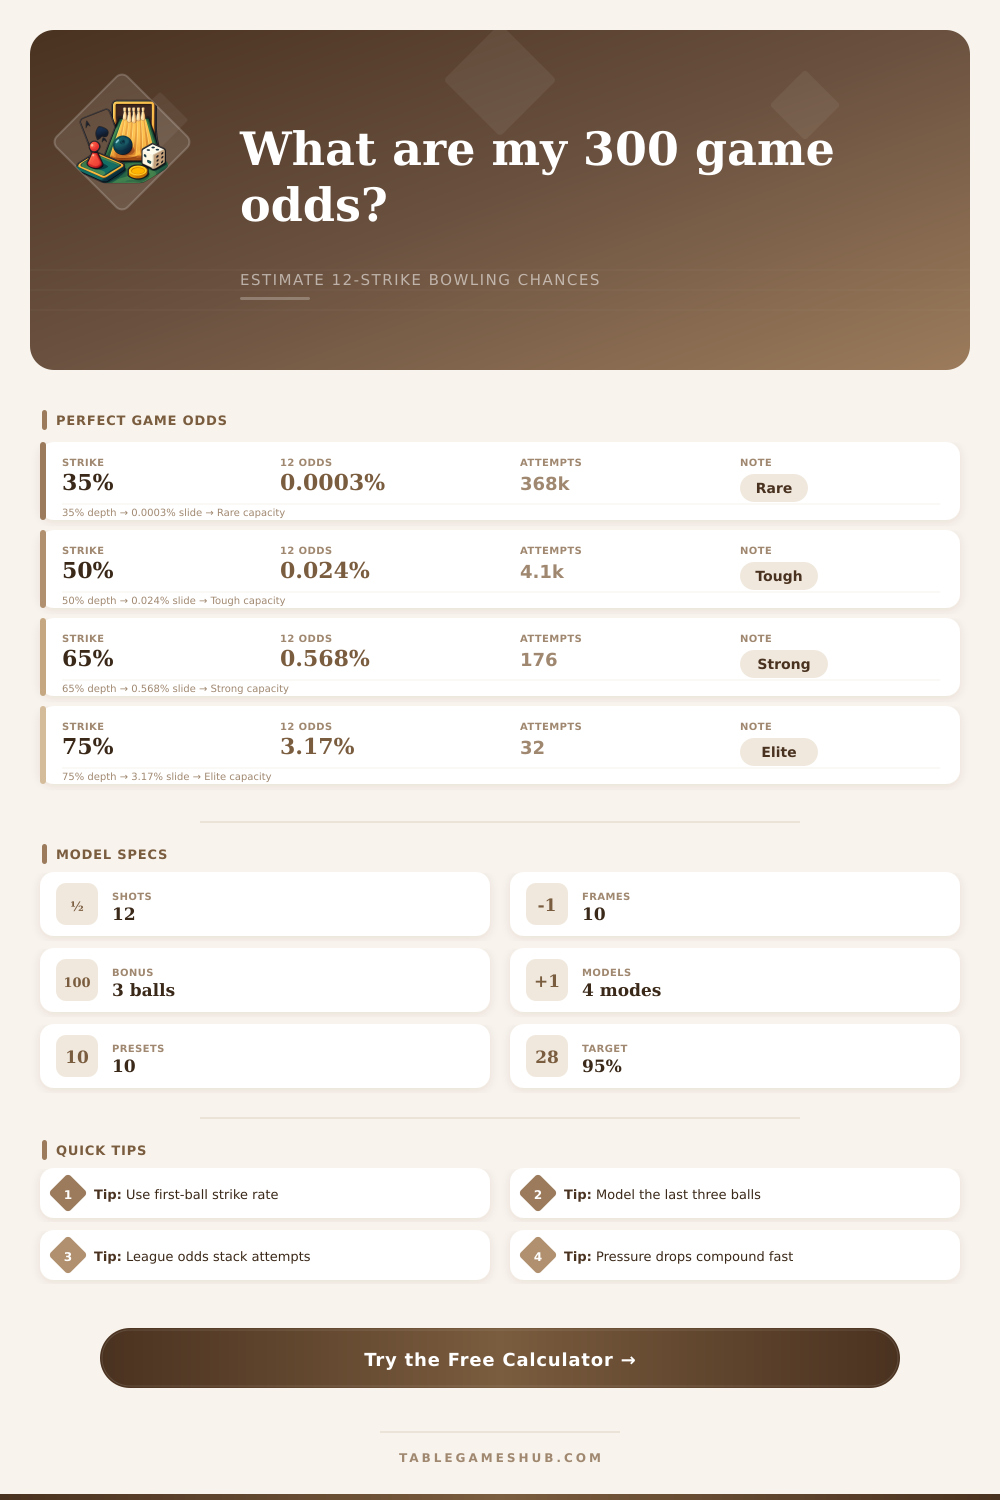
Reference odds by first-ball strike rate
| Strike probability | 12-strike odds | Approx. one in | Attempts for 95% | Typical interpretation |
|---|---|---|---|---|
| 30% | 0.000053% | 1,881,676 | 5,637,464 | Very rare casual pace |
| 40% | 0.001678% | 59,605 | 178,562 | Good but still long odds |
| 50% | 0.024414% | 4,096 | 12,269 | Strong strike rate |
| 60% | 0.217678% | 460 | 1,375 | High-volume contender |
| 70% | 1.384129% | 72 | 215 | Elite carry profile |
| 80% | 6.871948% | 15 | 42 | Exceptional sequence rate |
Preset scenario reference
| Preset | Strike rate | Model | League scale | Why use it |
|---|---|---|---|---|
| Casual 150 Avg | 35% | Independent | 1 bowler, 3 games | Baseline personal estimate |
| League 180 Avg | 45% | Pressure | 1 bowler, 3 games | Recreational league bowler |
| House Shot 200 | 55% | Pressure | 1 bowler, 3 games | Higher carry on friendly lanes |
| Scratch Bowler | 62% | Pressure | 1 bowler, 6 games | Competitive individual set |
| Tournament Pattern | 50% | Hybrid | 1 bowler, 8 games | Lower margin for carry |
| Elite Carry | 72% | Clutch | 1 bowler, 8 games | High-skill strike profile |
| 5-Bowler Team | 55% | Pressure | 5 bowlers, 3 games | Team night probability |
| Full Season | 58% | Pressure | 40 bowlers, 32 sessions | League-wide season estimate |
Tip: Enter first-ball strike percentage, not spare conversion or total frame win rate. A 300 game requires every one of the 12 scoring deliveries to be a strike.
Tip: Pressure adjustments matter most after the front eight because the last four strike balls are where small percentage-point changes compound sharply.
This calculator is a probability model, not a guarantee. Real bowling results depend on lane transition, ball reaction, carry, spare shooting, fatigue, and how accurately the chosen strike rate reflects current conditions.
A perfect game of bowling consist of twelve consecutive strikes. For a perfect game to be achieved, a bowler must strike twelve time in a row. For the first nine frame of a game, one strike is required for each frame.
For the tenth frame of a bowling game, three strikes are required, as this frame allow for extra bowling deliveries should the bowler achieve a strike. The probability of bowling a perfect game is calculated as the product of the probability of each individual strike needed for a perfect game. The slight change of a bowlers percentage of achieving a strike have a major impact on the probability of achieving a perfect bowling game.
Chances of Bowling a Perfect Game
For instance, a bowler with a 50% strike rate will have a differently probability of achieving a perfect game compared to a bowler with a 65% strike rate. A bowler’s percentage of achieving strikes are not an even number for each game. The percentage can change based off the conditions of the bowling lane and the type of bowling ball that the bowler uses.
Additionally, a bowlers strike percentage can change based upon the consistency of the bowlers game. The strike rate can be entered into the bowling game odds calculator as the most important variable for calculating the probability of bowling a perfect game. While the number of conversions of spares impact the score that a bowler achieves, it doesnt have an impact upon the calculation of the probability of a perfect bowling game.
A bowlers performance can change based upon the pressure that is placed upon the bowler to achieve high scores in longer games. A bowlers strike percentage can change due to the pressure placed upon the bowler, especially in the later frame of the bowling game. Many bowlers experience pressure after bowling eight or nine strikes in a game.
As a result of the pressure placed upon bowlers to achieve high scores in games, their percentage of achieving strikes can decrease. A pressure-adjusted model for calculating the odds of achieving a perfect bowling game will lower the strike rate expected for the last few frame of a bowling game to account for the impact of pressure upon bowlers performance. Even small reductions in strike rates will compound over time for those who attempt to achieve a perfect bowling game.
As a result, the odds will be lower for a pressure-adjusted model of calculating odds of bowling a perfect game compared to a model that dont account for the impact of pressure upon bowlers. Factors like fatigue and lane transition can also impact a bowlers strike rate. A lane transition occurs when the oil on the bowling lane changes, which can impact the way that the ball hit the pins.
A bowler can also become fatigued during long games, which can also impact the way that the ball hit the pins. A hybrid model for calculating bowling odds can adjust a bowlers strike rate for each successive game to account for fatigue and lane transition. Tournament bowlers can experience the effects of fatigue and lane transition.
As a result, different models can be used for the calculator that allow an individual to adjust for their own bowling situation. The number of bowling games that an individual must bowl in order to reach a certain level of confidence can be calculated based upon the odds of achieving a perfect game within a single game. For instance, if the odds of bowling a perfect game in a single game are 1 in 200, an individual will need to bowl a great many games to reach a 95% chance of having achieve a perfect game.
This number of games that must be bowed can help an individual to set expectations for the bowling season. The rarity of perfect games can be seen in these calculations, even for the best bowlers. The odds of a perfect game occurring within a bowling league can be calculated based upon the total number of bowling games that are bowled by all of the league members.
For instance, consider a bowling league consisting of forty individuals who each bowl three games each game night. The number of total games bowled by the league is very high. As a result, the odds that at least one member of that league bowls a perfect game increases with the number of games that the league members bowl.
Both views of the odds displayed in the calculator allow individuals to understand the impact that the total number of bowling games can have upon the odds of perfect bowling games. There are many variables for which a bowler may strike, but which cannot be accounted for in any mathematical model. These variables include the location of the ball in the pocket, the percentage of the ball that is carried on light hits, and the mental state of the bowler.
The lane on which a bowler bowls can change between games. This change in the lane can reward or punish a bowler for their games. These types of variables are one reason that two bowlers may have the same strike rate, but have different levels of success in bowling perfect games.
The reference tables provide an understanding of how different strike rates lead to different odds for bowling a perfect game. These tables show that the number of games that are required for an individual to bowl a perfect game decreases when a bowler has a strike rate of the high sixties. Additionally, using the calculator allows individuals to compare the independent model for calculating odds of bowling a perfect game to a pressure-adjusted model.
Additionally, the fatigue factor can be accounted for in the calculator to provide an understanding of how the number of games that are bowled during a bowling season may be impacted by fatigue. While the bowling odds calculator will not provide an individual with the date upon which they will bowl a perfect game, it can help the individual understand how many bowling games must be bowled in order to achieve that perfect bowling game. It should of been easier to calculate than that.
