Pythagorean Expectation Calculator
Convert runs or points for and against into expected win percentage, expected wins, record pace, and standings luck gap.
| Sport | Typical exponent | Scoring unit | Best use |
|---|---|---|---|
| Baseball | 1.83 | Runs | Modern run environment season standings |
| Baseball classic | 2.00 | Runs | Simple Bill James style estimate |
| Basketball | 13.91 | Points | NBA-style high-possession standings |
| Football | 2.37 | Points | NFL point differential review |
| Football classic | 2.00 | Points | Quick low-sample approximation |
| Hockey | 2.15 | Goals | Goal differential record check |
| Soccer | 1.30 | Goals | Low-scoring league approximation |
| Luck gap | Meaning | Standings note | Review angle |
|---|---|---|---|
| +5 wins or more | Actual record far above scoring profile | Close-game record may be lifting standings | Check one-score games and bullpen or late-game splits |
| +2 to +4 wins | Above expected, but not extreme | Record is a little better than point margin | Compare recent form and opponent quality |
| -1 to +1 wins | Record matches scoring profile closely | Standings and run or point margin agree | Use expected win percentage as a stable summary |
| -2 to -4 wins | Below expected despite scoring balance | Team may have lost more close games | Check injury timing, schedule, and clutch results |
| -5 wins or less | Actual record far below scoring profile | Strong differential has not become wins | Look for uneven scoring bursts or late collapses |
| Preset | Sport | Inputs | Why it helps |
|---|---|---|---|
| MLB balanced contender | Baseball | 760 PF, 710 PA, 162 games | Shows a modest run edge across a full season |
| MLB lucky close-game team | Baseball | 690 PF, 675 PA, 162 games | Shows a winning record that beats its run profile |
| NBA high-pace elite team | Basketball | 9350 PF, 8900 PA, 82 games | Shows why small scoring ratios matter in basketball |
| NFL close-win regression check | Football | 385 PF, 382 PA, 17 games | Shows how narrow point margin can trail record |
| Soccer low-scoring season | Soccer | 64 PF, 48 PA, 38 matches | Shows a lower exponent for goal-light leagues |
| Check | Formula or input | Output | Useful when |
|---|---|---|---|
| Expected win percentage | PF^x / (PF^x + PA^x) | Rate from .000 to 1.000 | Comparing teams with different scoring totals |
| Expected wins | Win% x games played | Estimated wins | Checking whether record matches scoring |
| Expected losses | Games played - expected wins | Estimated losses | Building an expected record line |
| Luck gap | Actual wins - expected wins | Wins above or below expected | Summarizing standings overperformance |
| Season pace | Win% x season length | Projected expected wins | Scaling partial-season samples |
If you’ve seen any amount of sports at all, you understand this: an 80-win team isn’t necessarily best team on the court or field. Maybe they caught some breaks. They won a couple more one-run ballgames. A half-dozen close contests ended up going their way even though they didn’t really deserve it. There was no sustained excellence, just good fortune.
Use Pythagorean expectation. By eliminating randomness of close-game variance, it give you an idea of what a team’s record would be were each contest a pure test of scoring margin. Plug in your scores and let the calculator above spit out the math for you. It turns raw point totals into a simple view of how well a team played compared to their actual position in standings.
How to Tell if a Team’s Luck Is Real
Bill James, the father of moddern-day baseball statistics, noticed that while wins and losses may be a poor indication of what’s to come, how many runs you score and how many runs you give up can actualy tell us more about your team’s future. Taking a page out of high school geometry (the Pythagorean theorem), he developed a formula in which winning percentage equate to points raised to an exponent divided by sum of points and points against raised to that same exponent. That sounds nerdy as hell, but it has a brutal, practical effect: It distinguishes between a good one-point winner and real strong team.
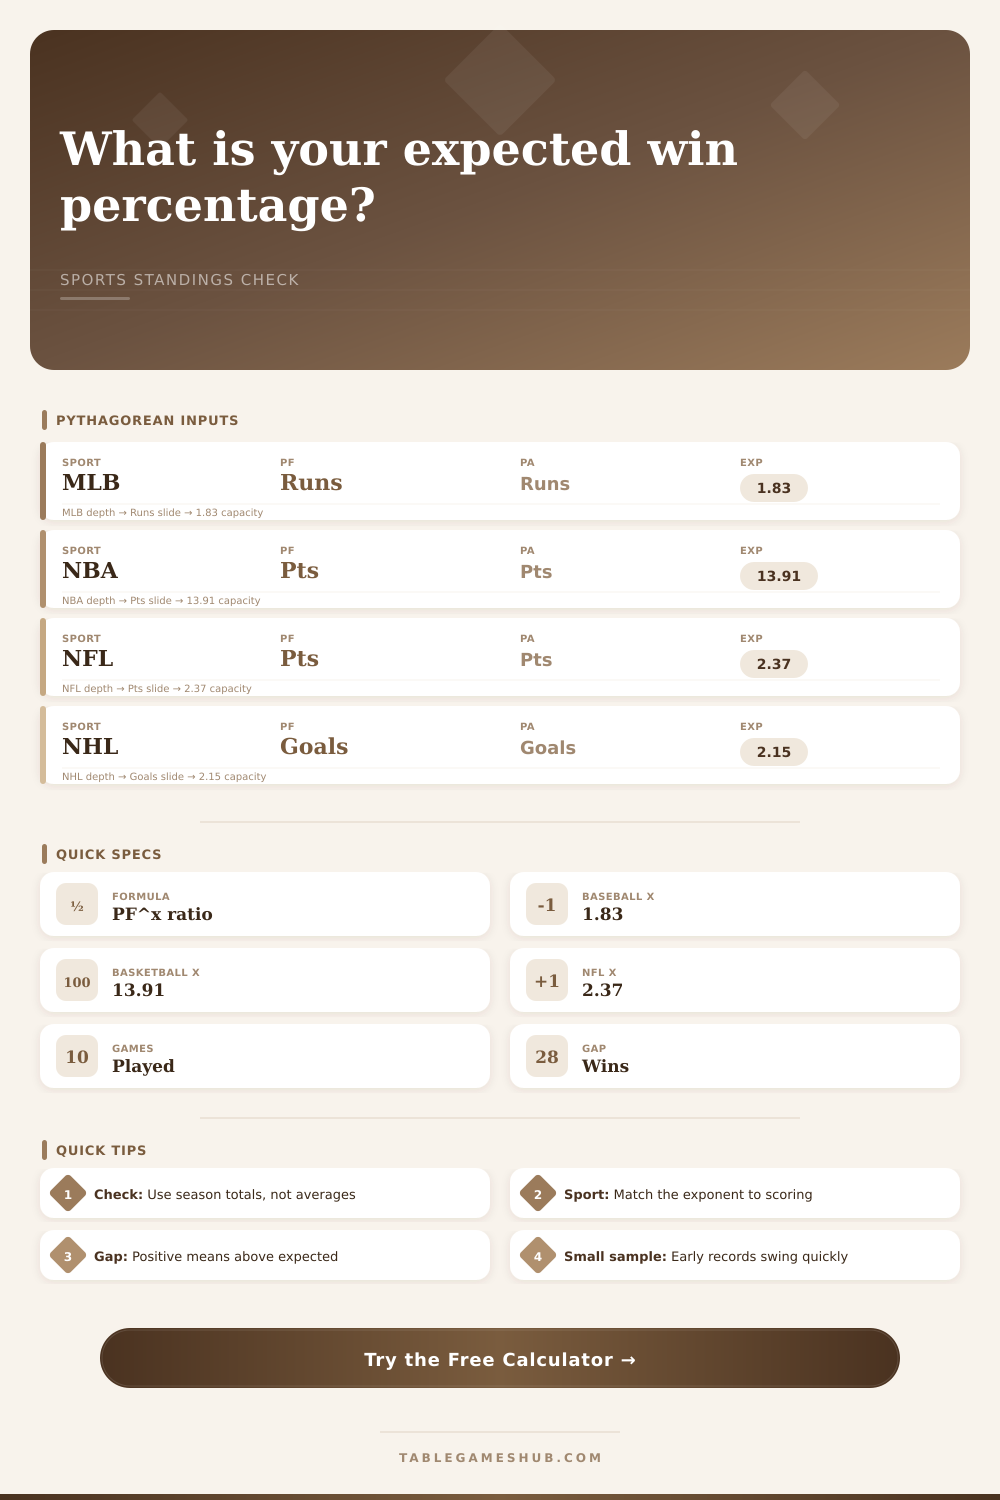
The exponent used for scoring frequency change the margin of error depending on the sport. The more often someone scores, the smaller difference needs to be for it to have an impact. Basketball features hundreds of points scored per game, so the smallest changes in efficiency compound very quickly. This is how you end up with an exponent close to fourteen for the NBA, which make the model extremely sensitive to point differentials. The value for baseball is lower, at about 1.83, and it is even lower for soccer where scoring events are rare. Using wrong exponent will skew results. And picking the right sport preset is vital before pressing the ‘calculate’ button.
It shows you some key stats, but the luck gap is the tell. It’s the delta between your actual wins and your expected wins. If it’s positive, that indicates that your team are outperforming their scoring profile, i.e., they’re winning an excessive amount of close games. If it’s negative, that means the reverse. Maybe you scored a bunch but lost a bunch of close games; your record is softer then your offense and defense would indicate. And that’s where folks frequently make mistake of writing off a.500 team that’s got a massive point differential: Usually they’re simply waiting on the correction to happen.
Depending on several random injuries or bounces early in the season, the luck gap can go all over the place. A team could go 5-0 but have a terrible point differential; it’s just an anomaly right? That’s where this tool come into play: It projects what their win percentage would be over a full season length. In other words, it smooths out the early noise and shows you trend line. And if you’re applying this to betting markets or fantasy leagues, then not accounting for underlying scoring margin is a costly mistake. Bet on the process, not the outcome.
And then there’s consistency: Are some teams capable of winning close games (timely defense/clutch hitting)? Or do they lose them all because of poor clock management and a bad bullpen? If we have enough samples, it tends to balance out. That’s what the model assume. The page includes a reference table that outlines traditional exponents for each major sport, no more guesswork! It grounds the math in past results instead of hunches.
So what is the main point? Pythagorean expectation is ultimately a reality check. It teaches us that winning and losing margins are lasting signals of quality, whereas records are frequently misleading snapshots. Even when you’re looking at a team that’s 10 games out of first place, or one deep into the playoffs, it’s likely the point or run differential that holds real truth, not the score itself. Sometimes scoreboard lies, but the math never does.