Games Behind Calculator
Compare a chasing team to a division leader with wins, losses, games played imbalance, winning percentage gap, and elimination context.
| Metric | Formula | What it shows | Common reading |
|---|---|---|---|
| Games behind | ((LW – TW) + (TL – LL)) ÷ 2 | Standings distance from the current leader | Every swing result moves the gap by one full game |
| Winning percentage | Wins ÷ games played | Performance rate when games played are uneven | Useful when one club has played more games |
| PCT gap | Leader PCT – team PCT | Rate distance independent of raw games | Small gaps can hide large loss-column pressure |
| Maximum finish | Team wins + team games left | Best possible chaser win total | If it trails leader wins, the chaser is eliminated |
| Tragic number | Season games + 1 – leader wins – team losses | Leader wins or team losses needed to clinch | Adjust by tie-break rule if a tie is enough |
| Scenario | Leader Record | Chaser Record | Why GB Looks Odd |
|---|---|---|---|
| Leader played one more | 40-25 | 39-25 | Chaser is 0.5 back because only the win column differs |
| Chaser played one more | 40-25 | 40-26 | Chaser is 0.5 back because only the loss column differs |
| Two-game imbalance | 50-30 | 49-31 | Both win and loss separation combine to a 1.0 gap |
| Same GB, different PCT | 60-40 | 57-41 | Chaser has games in hand but still trails the rate column |
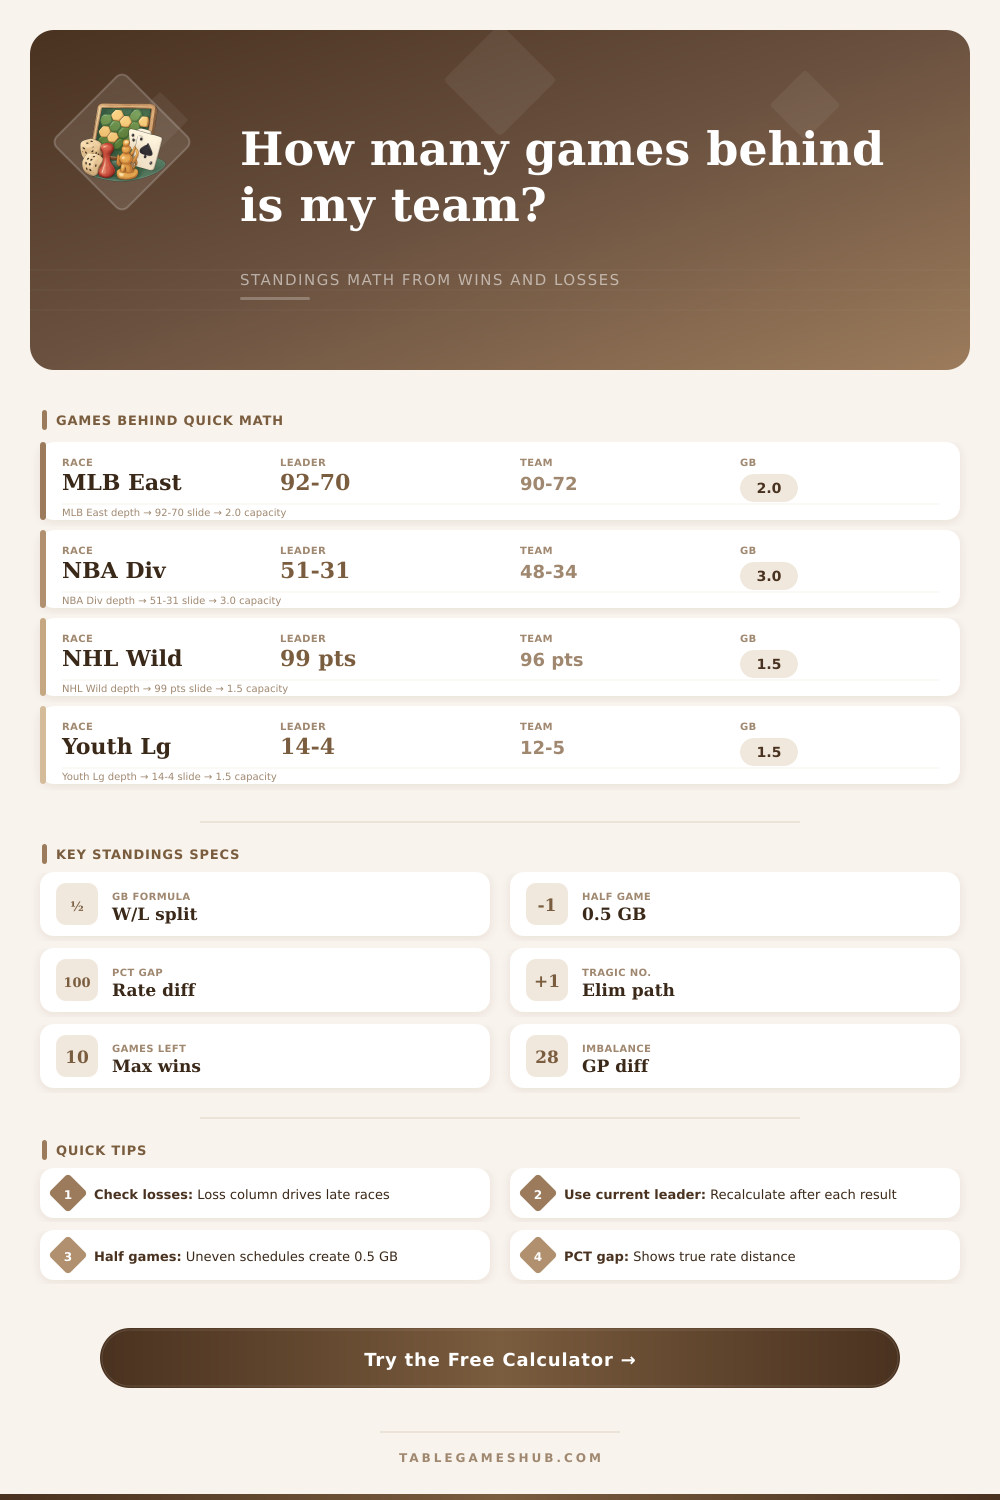
| Preset | Schedule Size | Leader | Chaser |
|---|---|---|---|
| MLB East: 90-Win Chase | 162 games | 92-70 | 90-72 |
| NBA Division: 3 Back | 82 games | 51-31 | 48-34 |
| NFL North: Half-Game Gap | 17 games | 8-4 | 8-5 |
| NHL Wild Card: Uneven GP | 82 games | 42-28 | 40-28 |
| Little League: Short Season | 18 games | 14-4 | 12-5 |
| Tragic Number | Meaning | Chaser Path | Leader Control |
|---|---|---|---|
| 20+ | Race is still broad | Can recover with normal hot streaks | Leader cannot clinch quickly |
| 10-19 | Loss column matters daily | Needs steady gains over several series | Leader reduces pressure by splitting games |
| 1-9 | Near elimination | Must win often and get help | Any leader win or chaser loss is costly |
| 0 | Eliminated or clinched | Cannot pass under the chosen tie setting | Leader has secured the target position |
The games behind calculation is a mathematical tool that help to calculate the number of games between the leading team and the chasing team within the standings list for sports teams. The wins and losses of each of these team can be accounted for within a games behind calculation to determine the number of games that the chasing team must win to even come close to the leading team. The games behind calculation is a valuable tool in that it show the difference in games between the two teams, as indicated by their win and loss records.
However, raw win and loss records do not always provide an accurate measurement of the distance between the two teams. For example, the chasing team may have a record that shows that it is two games behind the leading team. However, because the chasing team may have played more games than the leading team, it is possible that the chasing team is, in reality, closer to the leading team than the raw records would suggest.
Games Behind and How to Calculate It
To calculate the games behind between two teams in a sports contest, the wins of the chasing team can be subtracted from the wins of the leading team to determine the difference in wins between the two teams. Additionally, the losses of the leading team can be added to the wins difference to calculate the total number of games between the two teams. Finally, you can divide the total number of games between the two teams by two to calculate the games behind number between the two teams.
The games behind number help to determine the number of games between the two teams in the standings. However, the teams may have played different numbers of games during the season. Therefore, the games behind number may also be impacted by the number of games that each team has played.
For example, if each team has not played the same number of games during the season, the games behind number could be impacted by any postponed games between the teams. A half-game gap can develop between two teams if the number of games that they played was different than one another. For example, if one of the chasing teams played one additional game than the leading team, but accumulated the same number of wins as the leading team, then the chasing team would have one additional loss to the leading team.
Thus, the half-game gap between the teams indicates that the chasing team played one additional game than the leading team, but accumulated the same number of wins. A calculator can be used to determine the number of wins and losses for each of the teams in the standings list, as well as the number of games that remain for each team during that sports season. Because the calculator can account for the extra losses of the chasing team and the different schedules of each team, the calculator can provide an accurate display of whether the half-game gap is reflective of the actual distance between the teams, or if it is a result of the teams playing different numbers of games.
In addition to the games behind number, another statistic that can be calculated for each of the teams in the standings list is the winning percentage of each team. Win totals and loss totals for each of the teams can be accounted for in the winning percentage calculation to determine the winning percentage of each of the teams. Winning percentages provide another way to determine the rate of success of each of the teams.
Teams may have the same games behind number for each team, but teams may have different winning percentages due to the number of games that each team played during the season. A small difference in the winning percentages between the leading and chasing team indicates that the chasing team is competing at a similar rate to the leading team. A large difference between the winning percentages of the two teams suggests that the chasing team may have another problem in addition to the distance that they must travel to catch the leading team.
Another number that can be calculated for each of the teams in the standings list is the tragic number. The tragic number helps to calculate the number of wins and losses that must occur between the leading and chasing team in order for the chasing team to be mathematically eliminated from the standings. The tragic number can differ from the games behind number in that the games behind number calculates the number of games that must be won by the chasing team to even come close to the leading team in the standings list.
However, the tragic number calculates the number of wins and losses that the chasing team must win in order for them to no longer be eligible for the standings by the leading team. If the tragic number is determined to be a high number for the season, the standing for the season is likely still competitive by the leading team. Conversely, if the tragic number is determined to be low for that particular season, it is likely that the chasing team is in danger of being mathematically eliminated from the standings list by the leading team.
Within the calculator for these standings, the tie-breaker settings can be adjusted to reflect the different tie-breakers for different sports leagues. For example, in some leagues teams must end up in a win total that is strictly ahead of another team in order to be eliminated from the standings list. By changing the tie-breakers in the standings list calculator, the tragic number can change for each team within the league.
The loss column for each of the teams within the standings list can help to mathematically determine the position of the teams during the end of that sports season. For example, teams that accumulate fewer losses during the season will have an easier time closing the gap in wins for the standings than teams that have accumulated a large number of losses during the season. Additionally, teams that have fewer losses will have to win fewer games than teams that have many extra losses during the season in order to catch the team with the leading total for the standings list.
Additionally, the length of the season for which the standings list is determined will have an impact upon how quickly each of these standings numbers change. For example, if a sports season is shorter in length, then the number of teams that have earned wins and losses will change rapidly within the standings list for each team. However, if the length of the season increases for the teams, then the games behind number and the tragic number will change more slowly over a number of team seasons.
The games behind number is another statistic that can change with each game that is played by either of the teams within the standings list. The teams wins and losses can change with each game that is played by any of the teams, thus changing the games behind number. If the leading team wins a game and the chasing team loses a game to another opponent within the standings list, the games behind number between the two teams increases by two games.
However, if the leading team loses a game and the chasing team wins a game, the games behind number will decrease by two games for the season standings list. By using a calculator for standilings for teams, the games behind number can be updated after each game that is played by any of the teams. The number of remaining games that each of the teams have for the season can also have an impact upon the games behind number.
For example, a chasing team that is three games behind the leading in team with many games left in the season will have a different chance of winning the standings than a chasing team that is three games behind in number of wins but with few games left in the standings list for the season. Additionally, if the leading team has no more games for the standings list the leading team will not be able to earn any additional wins for the season. Conversely, if the chasing team still has games left in the standings list, the chasing team still has the chance of winning additional games.
The games behind number and the tragic number cannot take into account factors related to the teams themselves, such as whether any players on the team are injured, or the strategies that the team’s manager may use when the manager decides to rest some of the players on the team. Thus, while the games behind number and the tragic number can provide an indication of the likelihood of each team winning the standings list, that number does not factor in any adjustments that may be made to the teams for a variety of reasons. Instead, the games behind number and the tragic number provide a mathematical basis for determining the chance of each of the teams for winning the standings list, but the additional factors that may impact the chance of the teams winning the standings list must be accounted for with the judgment of the individuals that understand those factors.