Colley Rating Calculator
Estimate a simplified Colley rating from wins, losses, games played, opponent count, schedule strength, and the stabilizing base prior used in Colley-style ranking.
| Formula piece | Expression | Meaning | Calculator use |
|---|---|---|---|
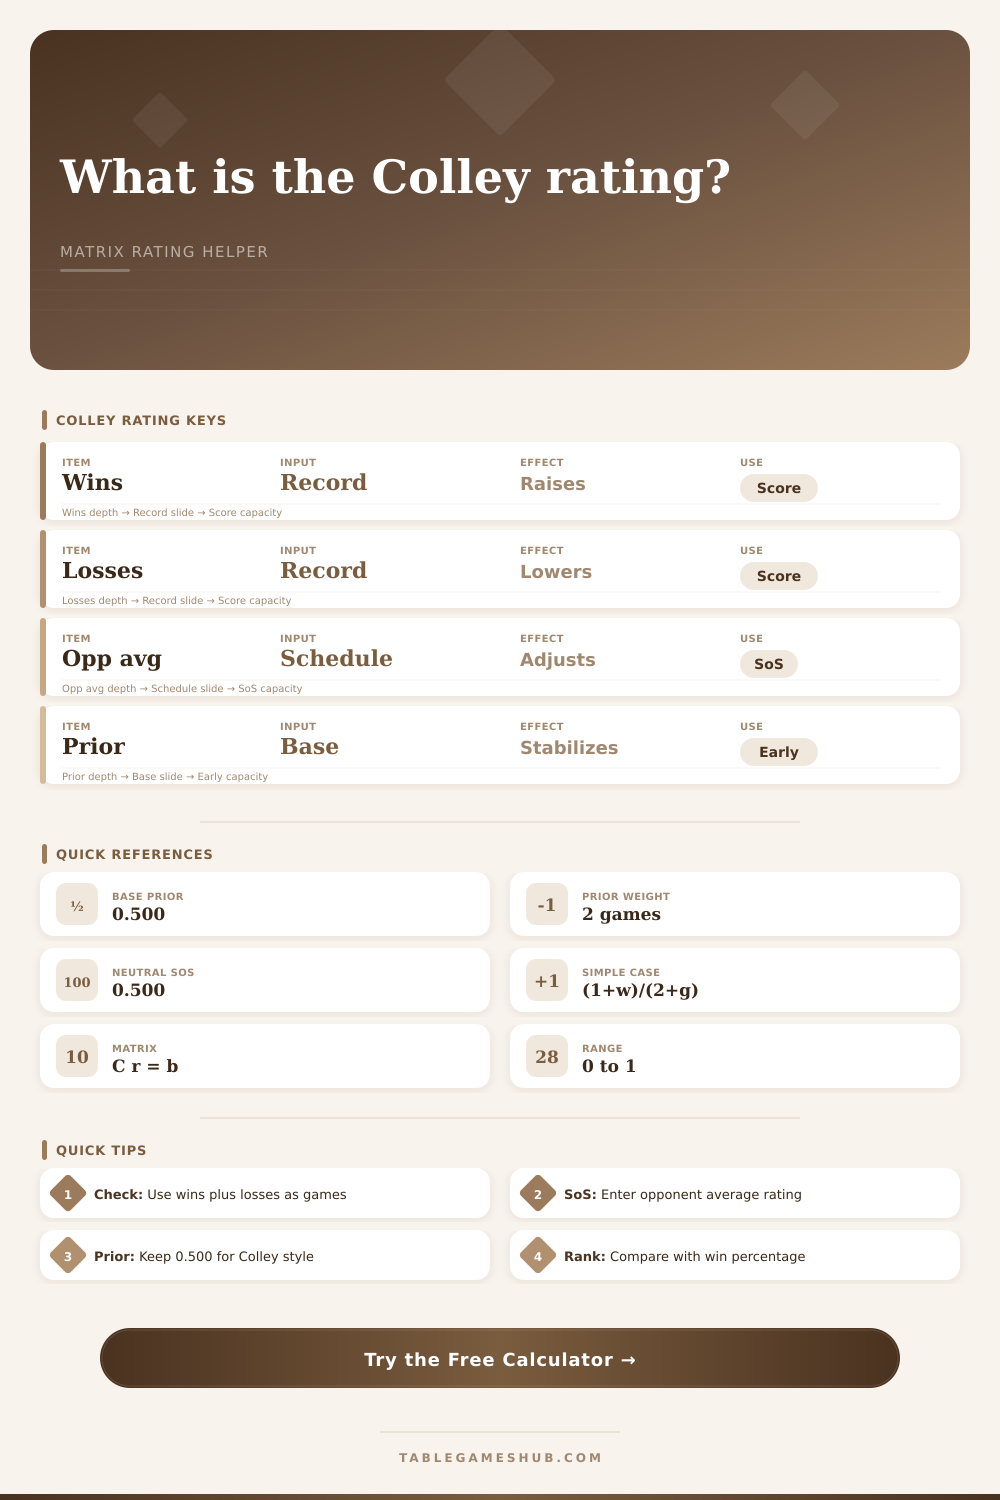
| Simple case | r = (1 + wins) / (2 + games) | Single-team form when the opponent side is neutral at 0.500. | Shown when prior is 0.500, weight is 2, and opponent average is 0.500. |
| Matrix equation | C r = b | The full method solves all team ratings together as a linear system. | Documented as the source method, not solved here. |
| Diagonal entry | Cii = 2 + games | The diagonal adds two stabilizing prior games to games played. | Mirrored by prior weight plus games. |
| Opponent links | Cij = - games versus j | Opponent connections pull each team through the schedule network. | Approximated with average opponent rating. |
| Right side | b = 1 + (wins - losses) / 2 | The record term that rewards wins and penalizes losses. | Displayed in the calculation breakdown. |
| Opponent average | Schedule label | Rating effect | When to use it |
|---|---|---|---|
| 0.650 or higher | Elite schedule | Large positive lift if record holds up. | Most opponents are high-ranking teams. |
| 0.550 to 0.649 | Strong schedule | Moderate positive lift. | Winning record against above-average field. |
| 0.450 to 0.549 | Neutral schedule | Small or no schedule correction. | Mixed field near average strength. |
| 0.350 to 0.449 | Light schedule | Rating is pulled below raw win percentage. | Many opponents rate below average. |
| Below 0.350 | Very light schedule | Large downward adjustment. | Use cautiously with small samples. |
| Simplified rating | Band | Typical record profile | Ranking note |
|---|---|---|---|
| 0.750 and above | Top tier | Excellent record or very strong schedule. | Usually ranks near the top of a compact table. |
| 0.650 to 0.749 | Contender | Good record with credible opponents. | Often beats raw win percentage ties. |
| 0.550 to 0.649 | Above average | Winning record or strong schedule balance. | Useful comparison zone for seeded events. |
| 0.450 to 0.549 | Middle pack | Near even record, average schedule. | Small changes can reorder the ranking. |
| Below 0.450 | Lower tier | Losing record or weak schedule result. | Prior can still soften very early standings. |
| Matrix item | Full method role | Simplified substitute | Important limit |
|---|---|---|---|
| Every team row | One equation per rated team. | One team row only. | Cannot produce an official full-table ranking alone. |
| Opponent ratings | Solved simultaneously by the linear system. | User-entered average opponent rating. | Accuracy depends on the entered schedule average. |
| Repeated games | Each repeat changes the off-diagonal link count. | Shown as schedule connection context. | Does not solve each repeat opponent separately. |
| Prior games | Colley adds two games at neutral strength. | Prior rating times prior weight. | Changing it moves away from the classic setup. |
| Margins | Not used by Colley. | Not used here. | Scores and point spreads are intentionally excluded. |
Everyone thinks, “Well, a team with a winning record should get the top seed.” It makes sense. You see a bunch of wins and losses, and it seem to say everything you need to know. But anyone who has organized a league or followed college football knows that not all win are created equal. A win over the bottom-feeder isn’t worth the same thing as beating your division champ. Even if the final result is the same.
That’s what these ratings try to capture: quality, not just quantity. And in that regard, Colley system works well. It ignores margins of victory, point spreads and other distractions. It only captures one variable: did this team win? Or lose?
How the Colley Rating Works
Once you input the specifics of your schedule and records, the calculator do all the work for you (above). No more guesswork about conversions and coefficients. Colley’s whole premise was to make things simple: each team starts with a rating, which is typicaly 0.500. No one has an advantage until a single game have been played, which is like flipping a coin and having a 50-50 chance.
Then as teams play, the ratings moves according to how well or poorly those teams perform against other teams whose own ratings are moving too. It’s a circular system, where your team’s strength come from beating the teams you play… And their strength comes from the teams they beat. That feedback loop make it strong.
The average opponent rating is probably going to be the most important number you see. It’s solved at once across all teams in the league in the full matrix version. When doing just a one-team estimate, you’ll need to make some kind of guess about strength of your schedule. Went 8 and 2 but had a weak schedule? Your rating will look much different then the rating of someone who went 8 and 2 against an average field of 0.400 instead of 0.650.
Even though you might’ve had a high winning percentage, the system punishes you for having an easy schedule by bringing your rating down. That keeps teams from being able to inflate their standing by simply scheduling only the weakest opponent.
It’s also got a stabilizer built into the formula. The formula adds two virtual games to every team’s record before calculating the final rating, which serves as a starting point for the overall rating. That earlier weighting means that early-season results doesn’t change drastically based off one or two games. A 3-and-0 team doesn’t immediately turn into the planet’s best team. The math drags that initial rise back towards the middle.
It also requires proof beyond what’s already been shown before handing out top billing. It is a small thing, but it is important for accuracy. It stops outliers skewing things when the schedule is still relatively sparse.
But when you break it down, the rating is based on a scale between zero and one. Anything over 0.750 is considered a great performance; anything under 0.450 would be struggling. It gives you an idea about the strength of schedule and how much of your rating came from pure wins and losses.
Maybe a team has fewer wins than you do but ranked ahead. So they played a brutal slate and survived. That’s where people fail to understand. They think that ranking means the same thing as winning percentage. And then they don’t consider the context behind how you got there.
The reference table on the page shows what each label means regarding the strength of their opponents average. If your record holds up, then an elite schedule will be a big plus for you. A light schedule will drag you down. Knowing those bands helps you understand that final number. It’s not a score, it’s a measure of competitive context. That can help you compare teams from tournaments or leagues with different strengths of field.
To conclude. The Colley rating is simply a more clean cut way of determining how well a team performed over raw numbers. While it takes into account the strength of schedule, it doesn’t gets caught up in point differential details. Instead, it requires you to think about who was on the other side of the line at any given time.
If you’re trying to fill out a bracket for your local fishing club or settle a bar debate, this will give you a logical way to compare apples to apples. It’ll take a string of wins and losses and turn it into a story of relative strength. Next time some bragger says he’s got an undefeated record, see who he fished against; it may just change everything.