Best of Series Odds Calculator
Estimate match-series win chance, clinch paths, expected remaining games, draw rematch load, and table scheduling for best-of-N tournament formats.
| Series format | Clinch threshold | Maximum decisive games | Common tournament use |
|---|---|---|---|
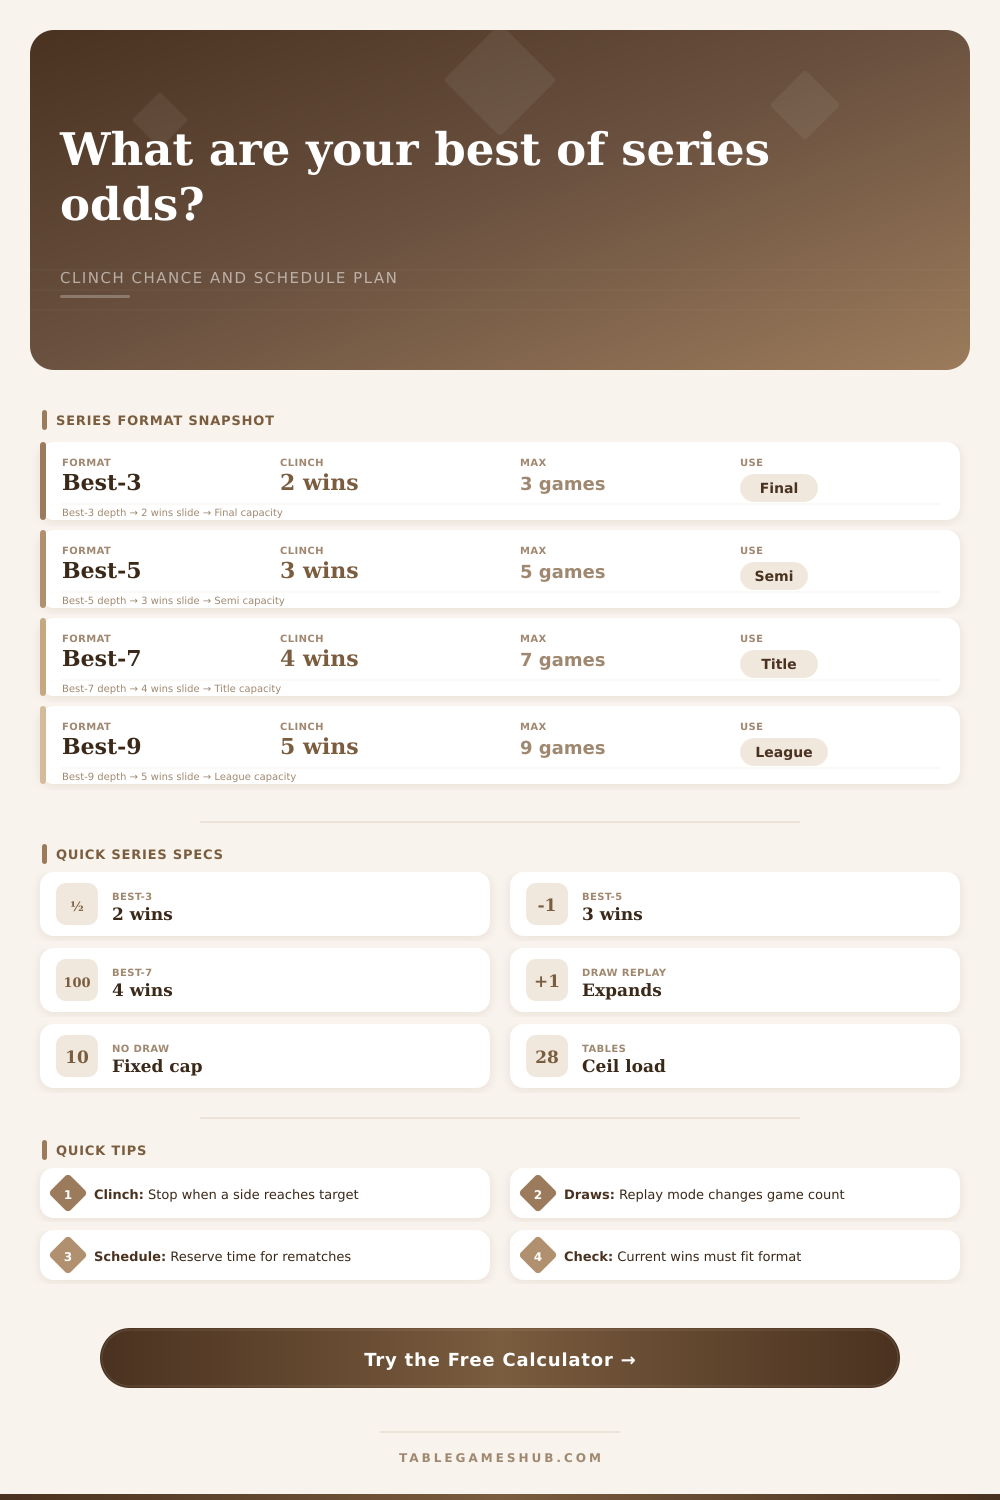
| Best of 3 | 2 wins | 3 games | Card-game finals, short board-game playoffs, compact local brackets. |
| Best of 5 | 3 wins | 5 games | MOBA semifinals, fighting-game finals, evening tabletop cups. |
| Best of 7 | 4 wins | 7 games | Esports grand finals, Go title matches, longer league playoffs. |
| Best of 9 | 5 wins | 9 games | Club ladders, mahjong sets, multi-night challenge matches. |
| Best of 11 | 6 wins | 11 games | Extended exhibitions where schedule slack is intentionally reserved. |
| Handling mode | Probability model | Schedule effect | Best fit |
|---|---|---|---|
| Replay draws until decisive | Negative-binomial race to target using decisive-only win rate. | Expected games divide by non-draw chance, so rematches expand table time. | Chess playoffs, drawn miniatures missions, board-game finals with replay policy. |
| Draw consumes scheduled slot | Finite DP over win, loss, and draw outcomes until cap or clinch. | A no-clinch state may need forced extras or organizer tiebreaks. | Round-limited events, timed table blocks, leagues with scoreless drawn games. |
| Immediate decisive tiebreak | Draw chance is set to zero before the series model runs. | Series length remains fixed at the best-of cap. | Esports overtime, Armageddon, sudden-death maps, judge-run final turns. |
| Game length | Best of 3 expected block | Best of 5 expected block | Table planning note |
|---|---|---|---|
| 15 minutes | 30 to 45 minutes | 45 to 75 minutes | Useful for fighting-game sets, quick card rounds, or digital stations. |
| 30 minutes | 60 to 90 minutes | 90 to 150 minutes | Good default for light board-game finals with short resets. |
| 45 minutes | 90 to 135 minutes | 135 to 225 minutes | Reserve buffer when draws or rematches are plausible. |
| 75 minutes | 150 to 225 minutes | 225 to 375 minutes | Better split across sessions unless several tables are available. |
| 120 minutes | 4 to 6 hours | 6 to 10 hours | Use multi-day scheduling for strategy games with slow boards. |
| Calculation | Formula used | What it assumes | Why it matters |
|---|---|---|---|
| Replay-draw win odds | Sum C(a - 1 + i, i) p^a (1 - p)^i | Player needs a wins, opponent gets i wins before the final clinch game. | Counts every possible clinch path exactly once. |
| Decisive win chance | p = win / (win + loss) | Draws are replayed and do not award series wins. | Separates match odds from rematch table load. |
| Finite-slot draw odds | Recursive DP over remaining slots | Each scheduled game can be win, loss, or draw. | Captures no-clinch probability before forced extras. |
| Expected games | Sum of path probability x path length | Future games are independent with stable probabilities. | Turns odds into practical table and session planning. |
As I mentioned before, being in charge of running tournament final introduces a unique sort of anxiety. It’s all about the tables, watching the clock tick down, knowing that this best-of-five match has the potential to stretch out into an entire evening.
It’s never very obvious what math looks like for these series. Our brains are terrible with multi-step independent probability. We tend to think linearly even though we live in an exponential world. That’s where calculators like the best of series odds calculator come into play. They manages the combinatorics for us; we can get it moving and keep it going.
How to Use the Calculator for Tournaments
Once we strip away all of this stuff, underlying concept is easy enough: you’re basically running a race to some threshold. For a best-of-five, someone has to get to three. Now suppose score is tied at one each. Both sides requires two more. From there, the calculator inputs current position and runs simulations using your win probability per game.
And it doesn’t spit out a raw percentage. No, it’s breaking down how many games it expects youll have left. On its face, it sounds great, hey, I’ve got a 70% chance of winning the series! But then you realize that means five more games at 45-minutes apiece which is a three-and-a-half hour stretch. Your tables is going to be busy. Your players are going to be exhausted. Your schedule will be shot.
Where most organizers get tripped up is draw handling. Some board games (chess, etc.) will have a draw as their own result. For other games (fighting games, some esports), there’s no such thing as a draw. The tool gives you options here to specify what to do about them.
If you go with replay, it will assume that all drawn matches will replay until someone wins. That seriously extends your expectation. A 10% draw rate doesn’t seem like much. But that will essentially make every decisive match much longer and it adds up quickly.
If you’re short on time, you may want to go with the consume mode. Here, a draw consumes one of the slots in the series. It ensures a hard stop but also leaves a risk of a deadlocked series down the line. It depends if you value punctuality or fairness.
Preset buttons help you check your work quickly: a Catan championship requires different assumptions about randomness and game length different than a StarCraft II grand final. But where it gets powerful is when you adjust manually. Maybe it’s a best-of-seven go match. Go games are long. If each game averages seventy-five minutes, a complete series could easily stretch to six hours. The calculator tells you what expected block time should be. If it seems like that’s unworkable at your venue then you know right away that you have to shorten the format. You can also decide to live with greater unpredictability in the outcome.
Predictions are also heavily influenced by what people don’t pay attention to, the current score. They view it as original format. Best-of-five will always be best-of-five, yes? No. When the score is two-one, everything changes. The player ahead isn’t playing a best-of-five anymore. He’s now playing a best-of-three with one won. The guy behind is scrapping for his life. He is down in a hole that requires him to play almost perfectly. If you take a step back and reset after each game you have the real picture. You stop underestimating pressure on the leader or overestimating how easy it is to come back.
And so here we get to the theory and pavement of scheduling. Your tables are not infinite. Your event has an end time. The load on those tables comes from the calculator. How many hours are your tables booked for? Four? And then you look at expected load and see four hours. Uh-oh. There’s no way you’re going to fit that into three hours, not while still cutting any corners. That’s when tool shows you the tradeoff. Extend the event and accept the longer format. Shorten the event and risk having a less definitive winner.
There are also a couple of handy reference tables on the page which are good for making side by side comparisons. These list out max number of games per format as well as the “normal” clinch threshold. Just keep in mind this is the cap. In most cases the series doesn’t reach the end. So the number of expected games will be less than the max. That’s what you should of worked with.
Plan for resets, breaks and unexpected hiccups. Your friend, the buffer.
In the end, running a tournament is all about handling the unexpected. Players may be good or bad at what they do. What you control is how you set up the game for them. Time and odds are things that can be understood; they eliminate guess work. Instead of wishing that the games go fast, you know the expected duration. Instead of scrambling chaotically, you make a decision. You click the button. The computer does the math. For you.