Season Standings Calculator
Project league points, points percentage, score differential, tiebreak position, and finish range for tabletop seasons, ladders, tournaments, and club nights.
The calculator keeps official points separate from projected and adjusted indicators so the standings math stays easy to audit.
| Format | Win | Draw | Loss | Typical Table Use |
|---|---|---|---|---|
| Association football style | 3 | 1 | 0 | Soccer, many club leagues, tabletop campaign seasons |
| Classic tabletop ladder | 2 | 1 | 0 | Board game nights, war-game ladders, compact round robins |
| Chess match scoring | 1 | 0.5 | 0 | Chess clubs, abstract strategy leagues, head-to-head match play |
| Win-only standings | 3 | 0 | 0 | No-draw formats where ties are broken before reporting |
| Projected Points % | Likely Finish Range | Differential Clue | Standings Read |
|---|---|---|---|
| 75% and above | Title pace | Usually positive | Controls its own finish unless penalties or tiebreaks intervene |
| 60% to 74.9% | Playoff or top tier | Positive or even | Strong season with a cushion against one late loss |
| 45% to 59.9% | Middle table | Often near even | Remaining schedule and direct rivals decide the seed line |
| Below 45% | Lower table | Often negative | Needs a hot finish or help from other results |
| Priority | Best When | Calculator Signal | Risk Note |
|---|---|---|---|
| Differential first | Every match reports comparable scores | Uses differential per completed match | Can overrate teams with one lopsided result |
| Head-to-head first | Small divisions play each other repeatedly | Weights wins more than margin | Incomplete pairings may delay clarity |
| Strength first | Unbalanced pods or Swiss pairings | Applies schedule adjustment to pace | Opponent strength changes as results arrive |
| Total wins first | Draw-heavy formats need separation | Raises finish confidence for high win counts | May undervalue hard-earned draws |
| Season Type | Common Matches | Useful Primary Metric | When To Recalculate |
|---|---|---|---|
| Single round robin | Players minus one | Raw season points | After each full round of reported matches |
| Double round robin | Two meetings per rival | Points percentage plus differential | At halfway and before final rematches |
| Swiss season | Fixed number of rounds | Strength-adjusted projected pace | Whenever pairings create harder or easier paths |
| Ladder campaign | Variable by player | Points percentage | Whenever completed match counts differ by two or more |
Any good tabletop league knows that the drama doesn’t come from simply counting number of games won. Typically, the drama center around what those wins mean for your final seeding position. Sure, maybe you’re ahead of the team sitting second because you’ve beaten them more times, but maybe they had an awful draw while your draw was cake.
That’s when things like raw points begin to mislead, and that’s why we convert that information into percentage pace. Enter your record and scoring rules into the tool above and let it do all the grunt work. You’ll instantly know exactly how you stack up against the rest of the field instead of only counting wins.
Why Points Percentage Is Better Than Raw Points
In casual formats where tie-breaks are complicated or number of games is uneven, people tend to focus on overall points. This is convenient and looks great. Points percentage levels things out so you see how much of those points you’ve earned as a percent instead. If you are halfway through a 12-game season, you have half your points. Great job! You think. Then you remember everyone’s got eight games in, whoops.
The calculator level out the variance. This lets you compare apples to apples without having to divide anything. It strips away the schedule noise to reveal only your performance efficiency.
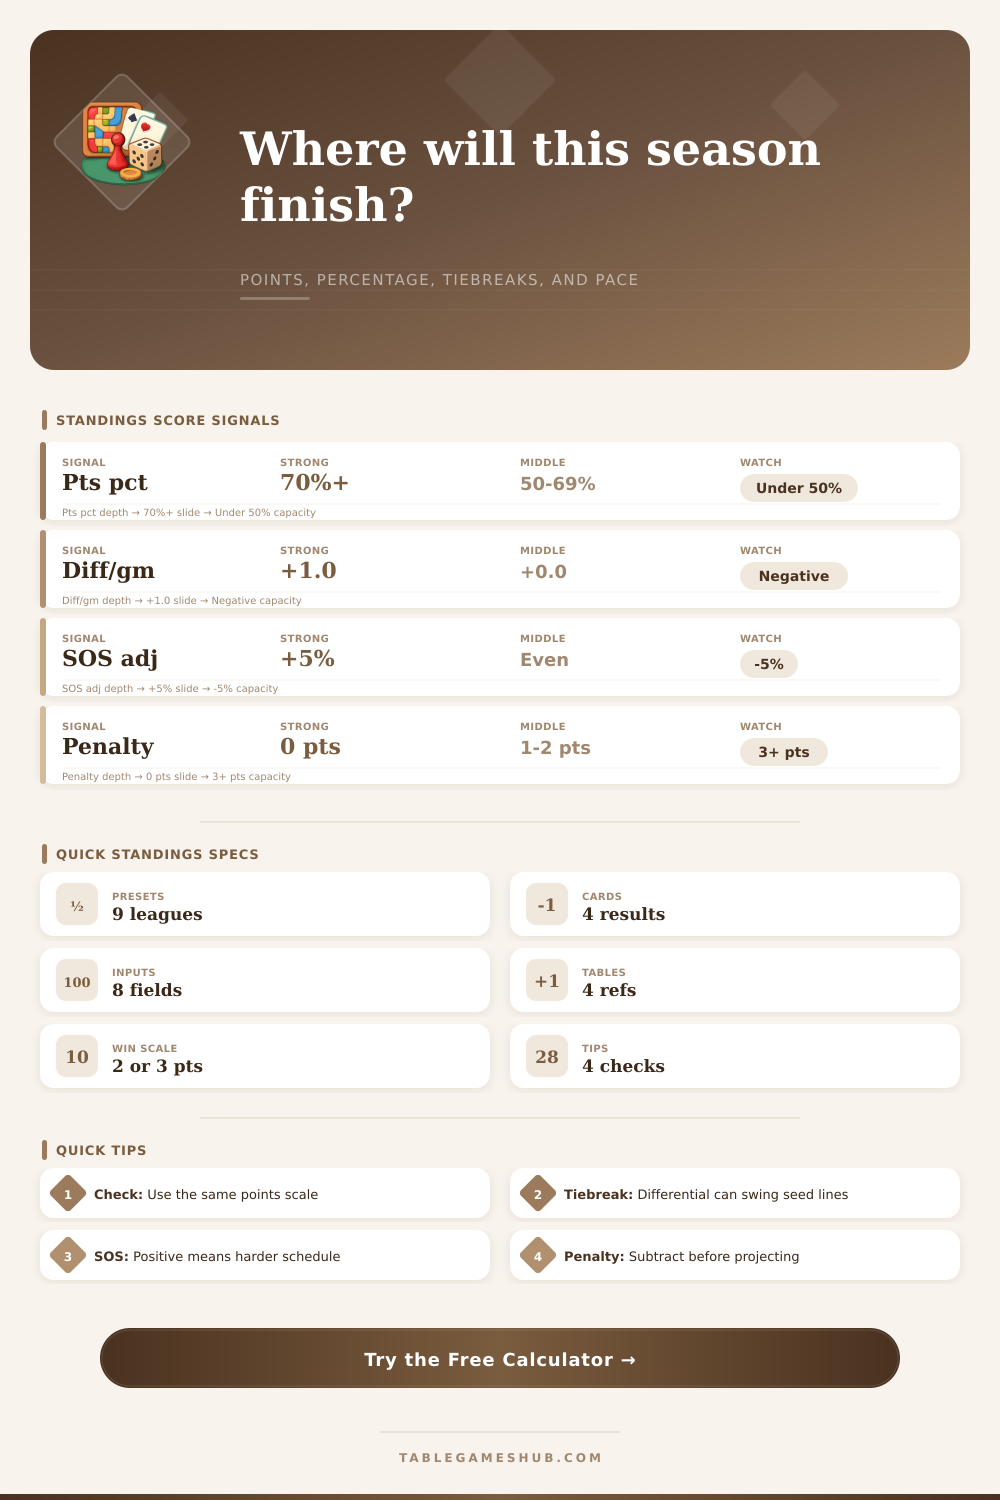
Differentials are another metric that will confuse more people then it helps. Some leagues makes it their top tie-breaker, after all, the one who wins by most points must have been stronger! Others find it too perilous, one single blowout can inflate your stats while hiding a string of razor-thin escapes. Regardless, you can adjust how heavily it’s weighed within the system depending on your league rules.
Differential doesn’t matter at all if everyone plays chess. But if they play miniatures wargaming with massive victory margins, then differential could be difference between first and last place in a deadlock.
Also, not all teams is the same. So it’s important to consider strength of schedule. It doesn’t feel as good winning over the bottom feeder, nor does it add much legitimacy. Nor does losing to top seed sting as bad when nobody else did either. That’s why including percentage points adjusts your projection based off whether you think your standing was given or earned.
Have you been playing cupcakes? Your raw point total may be higher than it should of. The adjustment will bring it back to earth and reveal how you would do if you were facing average competition.
The less glamorous side of calculating standings is penalties. While it may break ties, penalties can knock you down a peg if a few other anglers have been squeaky-clean throughout the year and only forfeit deductions or sportsmanship points taken off your score are enough to move someone below you. They can add up because what seemed like a small penalty for two points in November might look minor until March when every point becomes crucial as it determines the playoff bracket.
Don’t take penalties lightly in the early rounds. Enter them at the beginning so you aren’t surprised later when an admin error from months prior leaves you just outside the cutoff.
In addition to its calculator, there’s a set of reference tables that give some helpful baselines for how other games have played out in terms of points distribution. For instance, soccer has a three-point win system. This can create a pretty big gap between top and bottom teams, and there is no question of aggression being rewarded. In contrast, chess tends towards half-points, which clusters things tightly together and requires continual tiebreaker drama.
It’s important to know what model to expect from your team or league to understand the results properley. Sixty percent points is one thing when the game is prone to draws, quite another when it sees blowouts on regular occasions.
In conclusion: The standings are only a brief capture of momentum, which tells us about who’s been consistent up until now but doesn’t tell us anything about who will be next. Pace is more revealing than totals (it shows how you’re really doing), where you stand. And when you focus on standing instead of points, you begin playing for place, not pride. It transforms what feels like anxiety into strategy.