D12 Probability Calculator
Calculate exact d12 pool odds for sum targets, success thresholds, exact faces, reroll rules, keep or drop rolls, exploding dice, modifiers, and critical thresholds.
| Target | Favorable faces | Probability | Decimal |
|---|---|---|---|
| 2+ | 11 of 12 | 91.67% | 0.9167 |
| 4+ | 9 of 12 | 75.00% | 0.7500 |
| 6+ | 7 of 12 | 58.33% | 0.5833 |
| 8+ | 5 of 12 | 41.67% | 0.4167 |
| 10+ | 3 of 12 | 25.00% | 0.2500 |
| 12 | 1 of 12 | 8.33% | 0.0833 |
| Roll | Mean | Useful target | Chance at least |
|---|---|---|---|
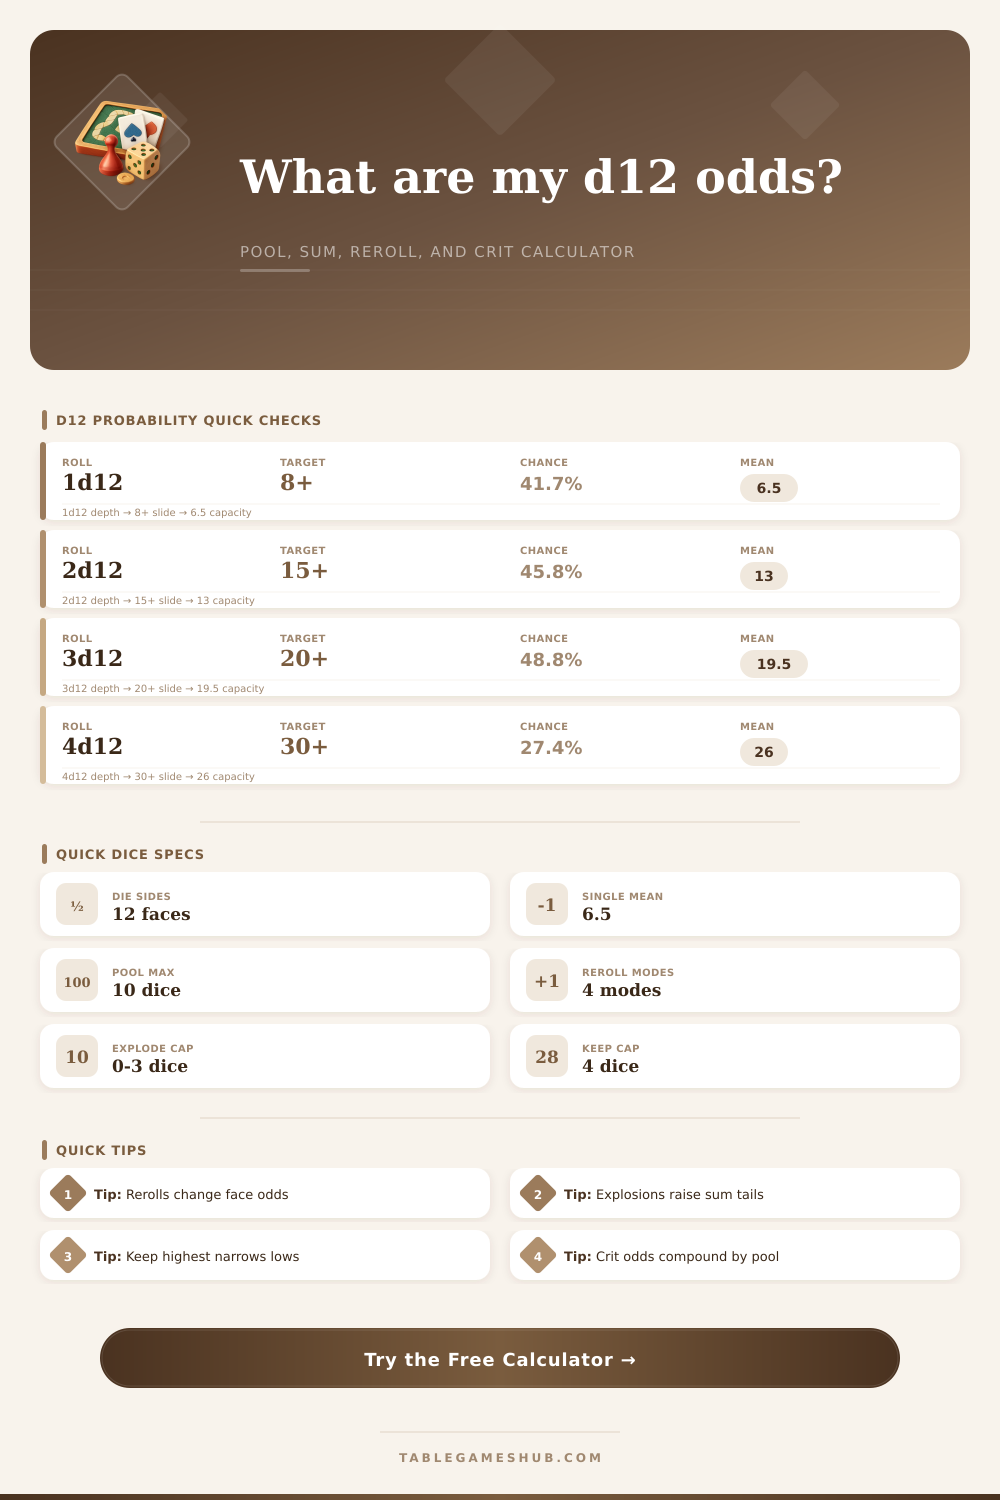
| 1d12 | 6.5 | 8+ | 41.67% |
| 2d12 | 13 | 15+ | 45.83% |
| 3d12 | 19.5 | 20+ | 48.84% |
| 4d12 | 26 | 30+ | 27.37% |
| 6d12 | 39 | 45+ | 24.57% |
| Pool | Face target | At least 1 | At least 2 |
|---|---|---|---|
| 3d12 | 8+ | 80.15% | 37.91% |
| 4d12 | 8+ | 88.43% | 52.76% |
| 5d12 | 10+ | 76.27% | 36.72% |
| 6d12 | 10+ | 82.20% | 46.65% |
| 8d12 | 12 | 50.07% | 13.47% |
| Rule | Affects | Probability effect | Calculator treatment |
|---|---|---|---|
| Reroll 1s once | Primary face | Raises mean to 7.0 | Second roll stands |
| Reroll 1-2 once | Primary face | Raises mean to 7.42 | Second roll stands |
| Keep highest | Sum total | Lifts low tail | Exact distribution |
| Drop lowest | Sum total | Protects against lows | Total minus minimum |
| Explode on 12 | Sum total | Raises high tail | Stops at cap |
Probability to most tabletop gamers is an unclear cloud of luck. Roll the dice. Hope for the best. But if you play a d12 system with damage caps or spell slots, you have to understand that those dozen sides makes a specific mathematical landscape. A d12 pool has more variance than a d6 pool. Predictability is lower. You don’t need charts to learn about the variance. You just need to know how to control the odds before you even grab the dice.
But one d12 is so innocuous. Its average (6.5) is smack dab in the center. Sounds reasonable enough. Except it isn’t about reason. But fairness is not what matters at the table. At the table, it’s about the threshold. And if that means you need an 8 or better to succeed? Your odds on each die are a stark forty-two percent. Worse than flipping a coin.
How to Use Math to Win Games
Volume is the antidote. And your biggest tool is pool size. Beyond raw arithmetic, adding dice adds more than numbers. They flatten the spread of results while increasing the average result with growing reliability. It calculates all that complicated math for you (see the tool above). It lets you concentrate on tactics. You won’t need to work out the number of combinations for rolling a four- or six-sided die four or six times.
Enter the pool size and apply any modifiers, rerolling, and keep-drop rules. It spits back a precise chance of achieving desired sum. It makes abstract risk a matter of concrete percentage.
Players often overlook rerolls as a slight change. A massive statistical adjustment happens with rerolls. Taking the ones and rolling them again on a d12 shifts the average for that single die from 6.5 to about 7.0. Not a big deal right? Actualy, it’s a pretty big deal. Every die you have in your pool gets this increase. That means if you are rolling six dice, you just added three additional points above what you were already expecting without any bonus at all. Every die you have in your pool gets this increase. That means if you have a six dice pool, you just added three additional points above what you were already expecting without any bonus at all.
You can set the tool to reroll just the ones, low numbers, or anything below a certain threshold and it will reroll it accordingly. Each setting changes the probability curve in a different way.
The inverse of a reroll is a keep and drop mechanic which ignores negative rolls instead of trying to fix them. By keeping the best dice, you chop off the bottom of the distribution. This makes your outcomes more predictable at the expense of capping your upside. When dropping the worst dice, you prevent yourself from taking a gut punch. This comes with a cost… You are exchanging extreme randomness for stability around the average.
This isn’t just something I say; there’s a table on the page that shows how success rates change as you move from using all dice to keeping only the top half.
The other source of chaos is exploding dice. Pure averages don’t really account for this. If you have a 12 on a d12 and it explodes again, then the ceiling of what you can get goes up… as far as makes sense. You can set a cap on the exploding dice with this tool. That’s important for maintaining game balance. A non-capped explosion can spiral out of control in terms of the average result. Cap the explosion and you’ll get those very occasional big spikes without breaking the encounter economy. It lifts the top end of the graph (raises the high tail) but doesn’t do much to the lower end results.
Sums is used for calculating probability and hitting target sums. Critical thresholds are measures of the actual chance of facing crits. A single die has a 1/12th chance to be a crit if you roll a 12. Once that number goes into play, the calculator figures out the probability of rolling enough dice where at least N of them become criticals. This could of been handy for creating a character whose power comes from an effect or burst damage instead of constant buildup.
The real skill in a d12 system is matching its mechanics to its goals. Are you looking for steady middling outcomes? Implement reroll-on-low rules and keep-high. Want the occasional shot-in-the-dark hit capable of changing the tide of a fight? Go all-in with exploding dice and embrace the variance. Define your priorities and the calculator above will do the math for you.
At the end of the day, probability isn’t about controlling fate. It’s about betting intelligently. There’s no way to make a 12 happen. However, there is a way to stack the deck such that your average result matches the strength you intend. Being able to distinguish between a statistical edge and a hopeful roll makes you a different player in the game. Luck becomes a resource that you use instead of a force you suffer.