🎲 Points Per Game Calculator
Track scoring pace across board games, card games, dice games, campaign nights, and tournament logs.
Enter completed-game totals, record data, opponent pace, and any manual scoring adjustments. The calculator returns adjusted points per game, table differential, projected score, and match points from the selected record system.
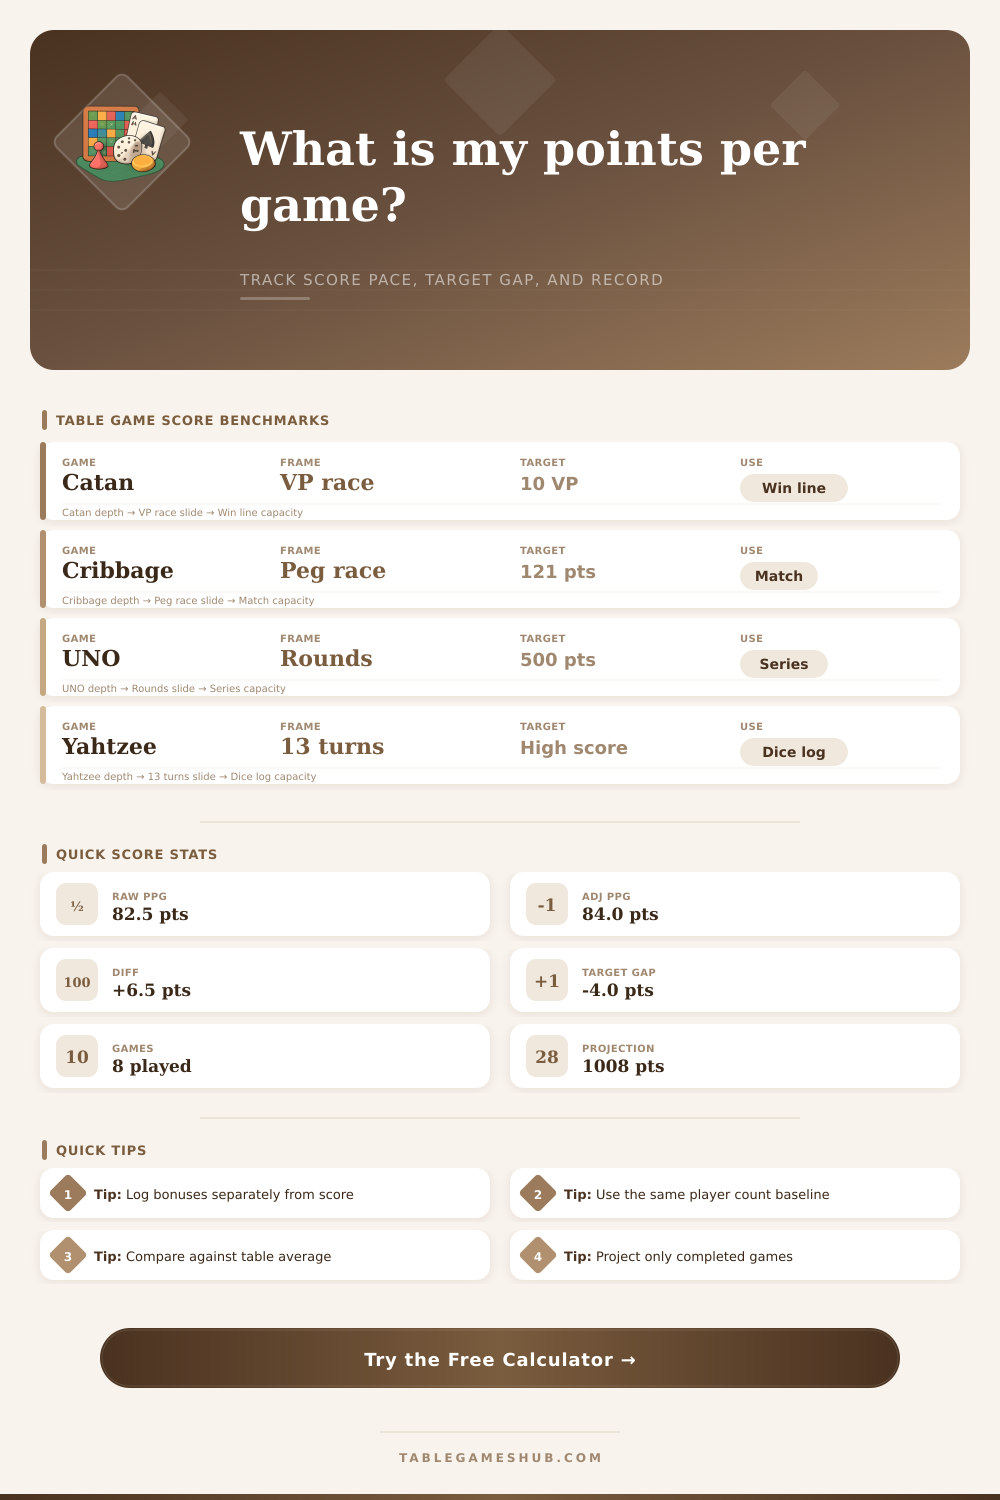
| Game or format | Score frame | Common target | PPG use |
|---|---|---|---|
| Catan base game | Victory point race | 10 VP | Track average finish strength over multiple games |
| Cribbage | Pegging race | 121 points | Compare completed-game scoring pace across matches |
| UNO scoring series | Round totals | 500 points | Average points earned from opponents' remaining cards |
| Yahtzee | 13-score sheet | High total | Compare score sheets by average completed game |
| Scrabble | Word score total | High total | Measure club-night scoring consistency |
| Measure | Formula | Good for | Watch out |
|---|---|---|---|
| Raw PPG | Total points / games | Simple score logs | Uncorrected bonus or penalty points |
| Adjusted PPG | (Total + bonus - penalty) / games | Campaigns and leagues | Only use agreed adjustments |
| Differential | Adjusted PPG - table avg | Head-to-head comparison | Needs a reliable table average |
| Projection | Adjusted PPG x future games | Season pacing | Small samples swing sharply |
| Match points | Wins/ties/losses scale | Ranked standings | Separate from raw game score |
| Preset | Typical score log | Table size | Best comparison |
|---|---|---|---|
| Wingspan Table | 70-100 per game | 3-5 players | PPG and target gap |
| Azul Mini League | 45-90 per game | 2-4 players | Differential and win rate |
| Ticket to Ride Night | 80-160 per game | 3-5 players | Projection and table average |
| 7 Wonders Duel Set | 45-85 per game | 2 players | Record points and PPG |
| Carcassonne Group | 70-130 per game | 3-5 players | PPG trend over repeated plays |
| Result band | Differential | Target gap | Read |
|---|---|---|---|
| Leading pace | +10 or more | At or above | Strong scoring trend for the table |
| Competitive pace | +0 to +9.9 | Within 5 | Close to the field and target |
| Catch-up pace | -0.1 to -9.9 | 5 to 15 short | Needs stronger finishing scores |
| Reset sample | -10 or lower | 15+ short | Check sample size and game mix |
Keep score types separate
Do not mix victory-point races, high-score games, and league match points in the same average unless you convert them to a shared scale first.
Use completed games only
Partial rounds distort PPG. Log unfinished games separately, then add them only when the final score is agreed by the table.
Most importantly, it helps fill a gap between thinking I’m getting better at a game, and actualy being better at one. Points per game scores turns board gaming from an abstract social ritual into a real collection of skills where you can clearly point to an improvement (or lack thereof) and back it up with evidence. This allows you to see patterns emerge while avoiding mistakes with the math (which is why we created the calculator above). All that’s required is for you to be honest when plugging in your numbers.
You’ll notice the input asks for both “raw” points as well as “adjusted” points. If unaccounted for, bonuses and penalties will skew results; they don’t show your strategic baseline. For example, a tourney bonus may elevate your average but it won’t represent how strong your skills is during competition. It’s important to log these separately so you get a more accurate idea of your true performance level. Bonus points earned through outside rewards can mask a fragil foundation in fundamental gameplay mechanics.
Why Tracking Your Scores Helps You Improve
Comparing raw numbers on one table versus another doesn’t account for context. Sixty points in a five-person game of Scythe isn’t anywhere near as good than 60 points in a three-person game. There aren’t nearly enough opportunity. The board state will be far more splintered than otherwise. The tool adjusts by player count, addressing this variable head-on. Although most casual players don’t realize how table density impacts their potential for points, competitive players know that having fewer opponents has higher ceilings per person. Knowing this ensures you won’t deflate your own ego while playing against a bigger group or inflate your confidence after an easy night with only two other at the table.
Maybe most helpful is ability to project. This will take where you’re at now and extend that out into the future, allowing you to see if you’re trending toward reaching your desired goal. So let’s say that your projected total falls short of your goal. Then you instantly know you’ll either have to speed up your studying or adjust what you’re doing moving forward to the next round. In other words, this lets you do some proactive planning instead of reacting with disappointment later.
In real time, you’re able to see the gap narrowing (or growing). That way you can make an adjustment when there’s still time left to affect the outcome of the games. The tool also includes reference tables of benchmark scores for some common games, which can be helpful as a starting point, though do keep in mind: house rules are crazy different. One person’s “standard” way of playing Uno isn’t necessarily the same thing as a game you might play at your local game store. Make sure to match whatever ruleset you’re using as your starting point with whatever the real-world baseline is when you go out and start logging.
Consistency in data collection is more valuable than precision in every single entry. Better to be slightly off on every entry then random and really accurate on some entries. In the end, it is about seeing trends. You can’t judge your playing ability based on a single poor performance. Ten consecutive poor performances, however, may suggest you’re fatigued or in need of a strategy refresh.
It helps to track both raw scores and points-per-hour. A high score that is heavily padded by extended breaks doesn’t compare well to more modest score where you played efficiently. That captures speed/efficiency, two important facets of mastering most board games today. At its core though, this method becomes real practice rather than merely playing games with friends. It shifts from guessing how well you’re doing to being able to measure it.
Your numbers become an unambiguous reflection of your performance: a mirror that objectively shows not only your strengths but also where you may be weak when your gut feeling isn’t enough. Clear data helps us make good choices whether we’re competing in a league or simply attempting to outsmart our spouse at Carcassonne. We know what’s happening because we can actualy see the evidence before us.
The score isn’t just a number on paper anymore; it’s a story detailing your progression as a player. You should of seen how much better you get.