Dice Expected Value Calculator
Model tabletop dice rolls with exact sum distributions, target odds, reroll effects, point payouts, miss penalties, and fair break-even values.
EVReal Dice Presets
Each preset fills the inputs with a familiar dice situation and recalculates with the same formulas.
INRoll Inputs
SPDice Component Specs
RTReference Tables
| Single die | Mean | Variance | Chance of max face |
|---|---|---|---|
| d4 | 2.5 | 1.25 | 25.00% |
| d6 | 3.5 | 2.92 | 16.67% |
| d8 | 4.5 | 5.25 | 12.50% |
| d10 | 5.5 | 8.25 | 10.00% |
| d12 | 6.5 | 11.92 | 8.33% |
| d20 | 10.5 | 33.25 | 5.00% |
| 2d6 sum | Combinations | Probability | Cumulative at least |
|---|---|---|---|
| 2 | 1 of 36 | 2.78% | 100.00% |
| 5 | 4 of 36 | 11.11% | 83.33% |
| 6 | 5 of 36 | 13.89% | 72.22% |
| 7 | 6 of 36 | 16.67% | 58.33% |
| 8 | 5 of 36 | 13.89% | 41.67% |
| 9 | 4 of 36 | 11.11% | 27.78% |
| 12 | 1 of 36 | 2.78% | 2.78% |
| D20 target | No modifier odds | With +3 odds | Break-even 1/-1 EV |
|---|---|---|---|
| 10+ | 55% | 70% | Needs 50% |
| 12+ | 45% | 60% | Needs 50% |
| 15+ | 30% | 45% | Needs 50% |
| 18+ | 15% | 30% | Needs 50% |
| 20 | 5% | 20% | Needs 50% |
| Dice scenario | Formula used | Expected result | Useful check |
|---|---|---|---|
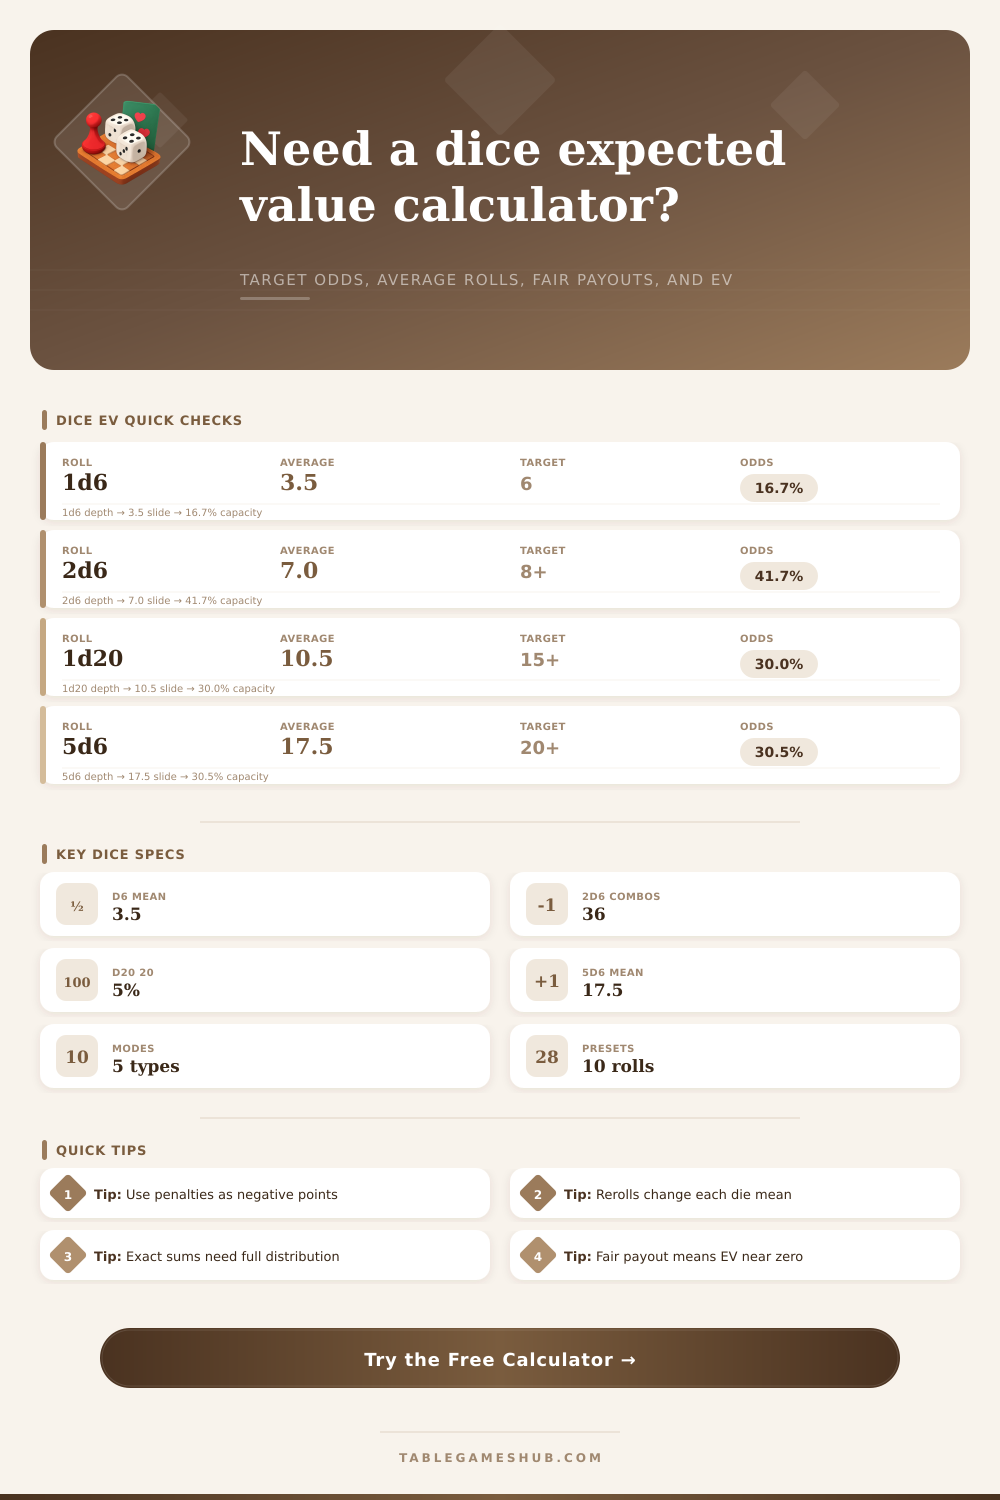
| 1d6 average | (1 + 6) / 2 | 3.5 | Uniform die mean |
| 2d6 average | 2 x 3.5 | 7.0 | Most common sum is 7 |
| 5d6 chance | 5 x 3.5 | 17.5 | Yahtzee chance baseline |
| At least one 6 on 5d6 | 1 - (5/6)^5 | 59.8% | Face event shortcut |
| Two or more 6s on 5d6 | Binomial tail | 19.6% | Count-success mode |
TPCalculation Tips
EV sign: Positive EV means the roll gains points on average under the payout and penalty you entered; negative EV means the miss penalty dominates.
Exact vs at least: Exact-sum targets are narrower than at-least targets. On 2d6, rolling exactly 8 is 13.89%, while rolling 8 or more is 41.67%.
Your opponent has moved to your expectation for the third consecutive roll. You’ve rolled a seven yet again, and there’s something about this sequence of events that seems like it must be a conspiracy. It is against your strategy. But, no: it isn’t; it’s only the way that the statistics hide themselves behind appearance of seeming randomness. We’re prone to recall the sequences which goes against our wishes: the streaks that cost us money. Yet we overlook silent steadiness of the mean. The expected value removes noise of any single roll. It reveals how it go down if those dice were thrown a thousand times rather than three. What had been an instinctive sense of risk transforms into iron-clad figure of faith.
After outlining your scenario, let the tool above do all the work. It spares you the headache of miscalculating your own probabilities. To get going, pick your dice pool and target conditions. Getting this step correct can make a enormous difference; most table top games uses either single-face checks or sums. If your movement in a game depend on combined total (like it does in many board games like Catan or Monopoly), use sum based approach. If it matters which single number you hit (as it usually do in role-playing games), go with face check. Selecting the wrong option shifts whole chance curve. Single-face odds are flat over each die while sum distribution is bell shaped.
How to Use the Dice Probability Tool
In those systems, there is modifiers that make all the difference. +3 to your roll doesn’t sound like much, but on a twenty sided-die, it moves your chances of success by fifteen percent. That’s the difference between winning consistently and losing casualy at a table over time. This calculator updates the odds immediately. Now you know exactly how your bonuses impact your risk profile. No mental calculations required. And you’ll be able to experiment with penalties. When failure comes at a cost, your expected value plummets rapidly. Unless you’re succeeding often enough to offset it.
Another aspect many overlook is the reroll mechanics. If you reroll a 1 on any die, you’ll get a little better result on average. But more importantly, the spread drops a lot. Your results are tighter and more predictable. You will have fewer catastrophic failures, which is important because one bad die roll can wreck your turn. The tool does something cool here: it recalculates the distribution given new conditional probabilities and tells you exactly how much protection that extra reroll gives you.
So how do you use this to calculate payouts for house rules or custom game designs? The rule is: to make something fair, if a mechanic has an equal chance of failure or success, then it should of a payoff ratio of 1:1 (one reward for success and no reward for failing). If there’s a greater chance of failure, the reward for success should be more than one. The reverse is true if the probability of success are less. Whether you’re designing your own card game or bickering with friends over some silly house rules at your local gaming store, knowing the math helps you see where mechanics aren’t balanced, before they suck all the fun out of the game.
The key to using this is to look at sum of all rolls instead of individual roll. A negative expected value may seem worthwhile if one is on a hot streak. However, the law of large numbers kicks in after 20+ rounds. The calculator estimates these session totals and allows you to determine if a risky play are viable for the length of time you are playing. It also shows the most probable outcomes as bars, which provide an easy way to feel how your scores is going to cluster. The majority of your rolls will be close to the mean. If you plan based off that central point, you’ll usually do better then seeking out those infrequent high-end rolls.
Knowing these probabilities shifts your play. You no longer fear bad variance; you realize it’s fleeting. When the odds is against you, you begin to value slow and steady over high risk and reward. You understand that consistency is key. The dice don’t give a damn what you want. They only obey certain mathematical laws. And when you catch a glimpse of them, the randomness on the table begins to feel a whole lot less random. Sure, maybe you’ll get snake eyes seven times in a row. But this time, you’ll know it was coming, and more importantly, how to adjust accordingly next game.