Bridge Matchpoint Percentage Calculator
🃏 Bridge Matchpoint Percentage Calculator
Convert board matchpoints, tops, adjusted scores, pair count, and average targets into a clear duplicate bridge session percentage.
Enter the boards actually scored for the pair. Standard pair matchpoints award two matchpoints for every pair beaten and one for every tie, so board top normally equals two times the number of other comparisons.
📍 Bridge Session Presets
⚙ Board, Top, and Adjustment Inputs
Use only boards with a score, artificial adjustment, or assigned average.
A pair field of 8 usually gives 7 comparisons, or a 14 matchpoint top.
Common formula is top = 2 x (pairs in field - 1).
Total matchpoints from scored boards before artificial adjustment entries.
Boards assigned above average, often treated as 60 percent unless your director specifies another value.
Boards assigned average, normally 50 percent of top.
Boards assigned below average, often treated as 40 percent unless directed otherwise.
Enter penalty matchpoints subtracted from the total session score.
Default 60 percent; adjust if a club or event uses a stated assignment.
Default 40 percent for an assigned below-average board.
Use this for qualification, overalls, or a personal session target.
Adds context to the readout without changing standard matchpoint math.
Session percentage-of available matchpoints-
Total matchpoints-after adjustments-
Target gap-versus selected target-
Average target-50 percent benchmark-
🧮 Calculation Breakdown
| Score component | Matchpoints | Percent effect | Formula detail |
|---|
-Board top
-Available MP
-Average MP
-Target MP
🂡 Bridge Scoring Component Grid
2
Win matchpoints
One tie gives one matchpoint.
50%
Average board
Above 50 percent improves rank.
60%
Average-plus
Director rules may vary.
40%
Average-minus
Enter the exact event rate.
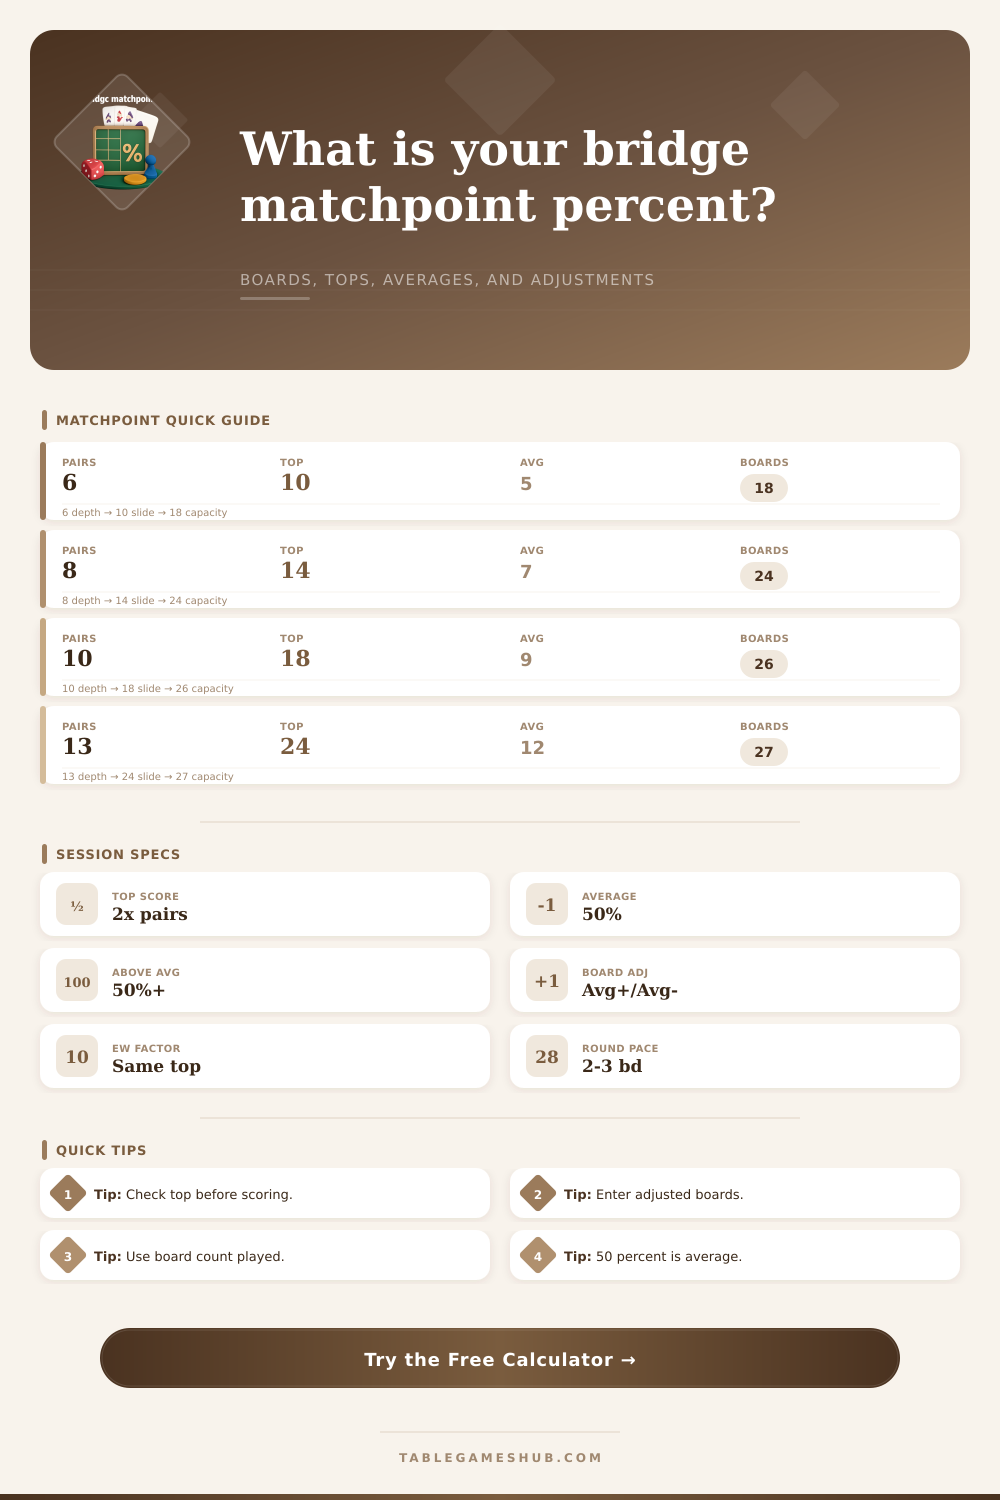
📊 Top Score by Pair Field
| Comparison field | Other pairs compared | Board top | Average board |
|---|---|---|---|
| 5 pairs on a board | 4 comparisons | 8 matchpoints | 4 matchpoints |
| 6 pairs on a board | 5 comparisons | 10 matchpoints | 5 matchpoints |
| 8 pairs on a board | 7 comparisons | 14 matchpoints | 7 matchpoints |
| 10 pairs on a board | 9 comparisons | 18 matchpoints | 9 matchpoints |
| 13 pairs on a board | 12 comparisons | 24 matchpoints | 12 matchpoints |
📝 Artificial Score Reference
| Assigned result | Typical rate | Matchpoint formula | Calculator input |
|---|---|---|---|
| Average-plus | 60 percent | Top x 0.60 | Average-plus adjusted boards |
| Average | 50 percent | Top x 0.50 | Average adjusted boards |
| Average-minus | 40 percent | Top x 0.40 | Average-minus adjusted boards |
| Penalty | Director stated | Total MP - penalty MP | Director penalty matchpoints |
🏆 Session Percent Bands
| Session percent | Matchpoint read | Typical use | Target behavior |
|---|---|---|---|
| Under 45 percent | Below average | Post-session review | Find lost top swings |
| 45 to 50 percent | Near average | Club pair baseline | Gain half-board ties |
| 50 to 55 percent | Above average | Solid section result | Protect average boards |
| 55 to 60 percent | Strong session | Often competitive | Convert plus scores |
| 60 percent or more | Excellent session | Likely high finish | Maintain board tops |
⚖ Movement and Spec Comparison
| Scoring context | Common board load | Top handling | Best input check |
|---|---|---|---|
| Mitchell pairs | 24 to 27 boards | Separate NS and EW fields | Use the pair field for your direction |
| Howell pairs | 18 to 28 boards | One comparison field | Confirm table count and sit-outs |
| Barometer | Round-by-round | Same top after each update | Add earned matchpoints after each round |
| Stratified game | Club standard | Overall score unchanged | Use percent for each strat ranking |
Board Top Check
If the field has eight pairs compared on a board, the board top is 14 matchpoints, not eight. Always confirm comparisons, not tables.
Adjustment Check
Artificial boards still add to available matchpoints. Enter average-plus, average, and average-minus counts before judging the final percentage.
Matchpoint percentage is a way to measure a bridge score against the other players in the room. The matchpoint percentage will turn your raw number into a single figure that will show where you stood in comparison to the other player in the field. In order to calculate your percentage, you need to enter the number of boards you played, the number of pairs in the field, and any adjustments made by the games director.
Knowing these variable will allow you to find your percentage. Matchpoint percentage use a scoring system for each board. For each board, you will receive two points for every pair that you beat and you will receive one point for every tie that you have with another pair in the field.
How to Calculate Matchpoint Percentage in Bridge
The maximum number of points for a board is two times the number of pair in the field. For instance, if there are eight pairs in a field, the maximum score is 14 points. If there are 13 pairs, however, the maximum score would be 24 points.
The number of pairs in the field will determine the maximum score for each board, so it is essential to know the number of pairs in the field in order to properly determine your percentage. The number of boards that are played in a session can also have an impact on your percentage. Many bridge game use 24-27 boards for a session.
Sessions of this length will allow players to have steady results during their games. Sessions of 18 boards, on the other hand, will make each board more important to your percentage. Sessions that play for longer duration will allow the law of averages to provide players with more consistent results.
The number of boards that were played during the session must be entered into the percentage calculator to ensure that your percentage is accurate. The games director can assign Artificial score to a bridge game. These artificial scores are given to each player as either an average-plus score or an average-minus score.
An average-plus score is often set at 60% of the total points for the field and an average-minus score is 40% of the total number of points for the field. These artificial scores will impact the total number of boards played in the session. As such, artificial scores will raise the bar for the remaining boards in the session to reach the same percentage as the other.
A bridge games director will give a penalty to a team. This penalty will subtract from the total number of points scored by the player. The director will give this penalty after each board is completed.
The number of points that a player will lose with this penalty will depend upon the total number of boards that were played in the session. For instance, a penalty of three matchpoints will have a more greater impact upon a player if the session consisted of 18 boards instead of 24 boards. The penalty score can be entered into the percentage calculator so that it is reflected in the players percentage.
The movement in which the bridge players will compete can also have an impact upon the percentage calculations of each player. In a Mitchell movement, for instance, the North-South pairs will compete against each other and the East-West pairs will compete against each other. In a Howell movement, the same field of players will be used for each round but some of the players will be sit-outs.
These movements can be selected in the percentage calculator so that the impact of each movement on the percentage is accounted for in the calculations. The average score in a game of matchpoint is always 50%. Many competitive bridge player feel that scoring 50% or more is a success.
A score of 48%, for instance, may be considered a strong score if the player competed against an opponent field that is generally strong. On the other hand, a score of 52% may be considered a relatively weakly score if the field is weak. Thus, the matchpoint percentage only shows how the player compared to the others in the field but does not account for the strength of the field.
By keeping track of each players percentage calculations, it is possible to determine whether an individual players percentages are lower during long bridge sessions compared to short sessions. Additionally, by tracking the percentages of each player, it is also possible to determine if a player is too cautious in bidding on bridges that has high top scores. By keeping track of each player’s matchpoint percentages, individual results can become data that is used to improve each players game of bridge.
By entering specific parameter into a percentage calculator, it is also possible to set a personal target percentage for bridge games that are played. This target percentage can be established if the player wish to qualify for a bridge game final or to determine how much score they need to earn to reach that target. The calculator will show the gap between their total score and their target percentage so that each player can determine the type of score they need to earn on any remaining bridge boards.
A percentage can be calculated at the end of each bridge game that is played. That percentage will describe the players percentage relative to the other players in there field. The percentage will describe in what position the player stood during their game but will not state anything about that players skill in bridge.
Thus, a percentage can be used to either celebrate a great result or to recognize in what areas the player needs to improve their game of bridge.
