Horseshoe Ringer Percentage Calculator
Horseshoe Ringer Percentage Calculator
Measure ringers thrown, shoes thrown, games or innings played, recent trend, target ringers needed, and head-to-head comparison in one score sheet.
Enter a player's ringers and shoes, choose the match length, add a recent session log, and compare against a second player or a target ringer percentage.
1Presets
2Ringer Inputs
Used only for labels in the comparison and breakdown.
Sets the expected shoe pace shown in the breakdown.
Count every shoe that encircles the stake as a ringer.
Use actual shoes thrown for the cleanest percentage.
Optional, but useful for per-game pace.
An inning is one turn cycle; many sheets show four shoes total.
The calculator estimates ringers needed to reach this target.
Shows how many of the next shoes must be ringers.
Leave default if you only need a solo session check.
Comparison uses Player B's own shoe count.
Set to zero to hide the head-to-head edge.
Uses the recent ringer log below.
Enter ringers by game, block, or inning group. Separate values with commas, spaces, or line breaks.
3Results
Ringer percentage
22.5%
18 ringers / 80 shoes
League steady range
Target ringers needed
12
of next 40 shoes
30.0% required pace
Trend
+1.5
late half vs early half
Rising recent blocks
Player comparison
+5.0%
Player A edge
18 vs 14 ringers
18
Ringers thrown
80
Shoes thrown
9.0
Ringers per game
League
Performance band
4Breakdown
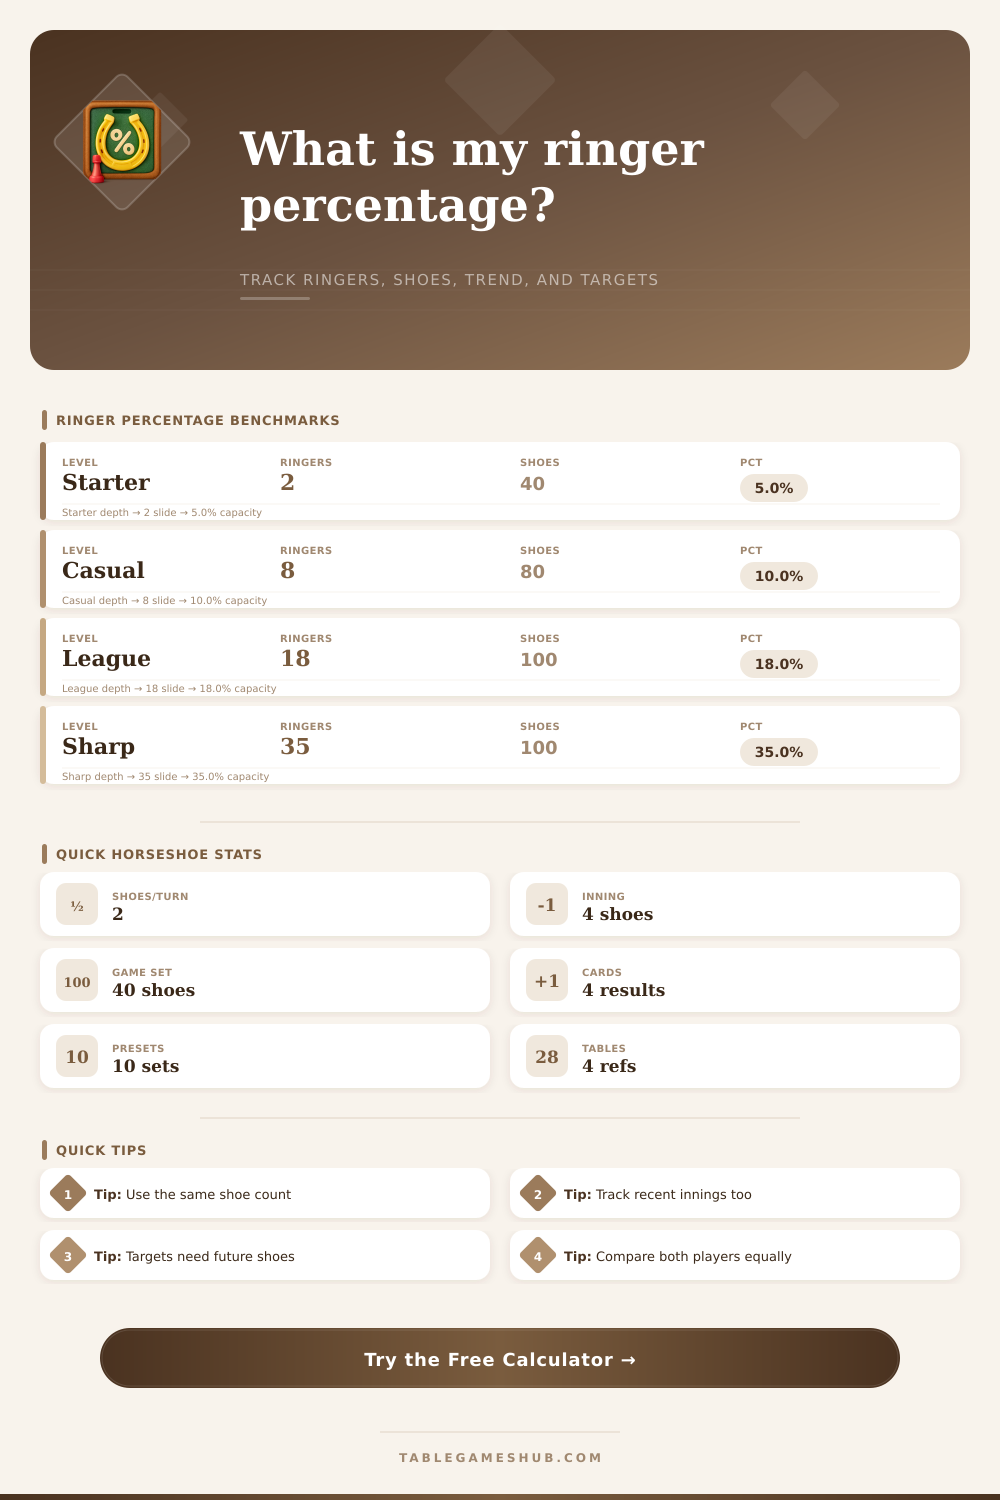
5Ringer Percentage Benchmarks
| Band | Ringer percentage | Typical use | Reading |
|---|---|---|---|
| Starter | 0% to 7.9% | Early practice | Focus on consistent release notes |
| Casual | 8% to 14.9% | Backyard or club play | Reliable enough to compare sessions |
| League steady | 15% to 24.9% | Local match sheets | Strong enough for target tracking |
| Competitive | 25% to 39.9% | Advanced league play | Small misses change the matchup |
| High ringer pace | 40% and above | Sharp tournament form | Use equal shoe counts for comparison |
6Format Reference
| Format | Expected shoes | Good for | Calculator note |
|---|---|---|---|
| 40-shoe game | 40 per player | Standard match line | Two games equals 80 shoes |
| 50-shoe game | 50 per player | Longer score sheet | Useful for stable averages |
| 30-shoe short game | 30 per player | Quick club check | Percent can swing quickly |
| Innings count | 2 shoes per player | Frame-by-frame sheets | Twenty innings means 40 shoes each |
| Open practice | Any count | Drill blocks | Actual shoes matter most |
7Target Ringer Table
| Current sample | Current pct | Target pct | Future need over 40 shoes |
|---|---|---|---|
| 8 / 80 | 10.0% | 15.0% | 10 ringers, 25.0% pace |
| 18 / 80 | 22.5% | 25.0% | 12 ringers, 30.0% pace |
| 26 / 100 | 26.0% | 30.0% | 16 ringers, 40.0% pace |
| 35 / 100 | 35.0% | 40.0% | 17 ringers, 42.5% pace |
8Trend Log Guide
| Log style | Example | Best method | Meaning |
|---|---|---|---|
| Game blocks | 5, 7, 8, 9 | Halves | Late match ringer lift |
| Long practice | 2, 3, 5, 4, 6, 7 | Thirds | Shows warm-up improvement |
| Target check | 8, 9, 7, 10 | Target | Average block vs target line |
| Short sample | 3, 4 | Halves | Directional only, not stable |
Compare equal or actual shoe counts
Ringer percentage is ringers divided by shoes thrown. If players threw different totals, compare percentages first and raw ringers second.
Use target ringers as a pace check
The target card shows whether the next planned shoes can realistically lift the total average to the goal percentage.
Use the breakdown to copy the exact ringer formula, recent trend, target pace, and player comparison into a league sheet or practice notebook.
A ringer percentage calculator is a tool that help to measure an individual’s performance within the sport of horseshoe pitching. Horseshoe pitching involve individuals throwing they shoes toward a metal stake in the ground in order to score point for their effort. Should the shoe wrap around a metal stake, it is referred to as a “ringer.” A ringer percentage calculator allow an individual to calculate the number of ringers that they have thrown relative to the total number of shoes that they have thrown.
The percentage itself is calculated by dividing the number of ringers that were thrown by the total number of shoes that were thrown. This percentage is useful in that it will accurately reflect the skill of the horseshoe pitcher relative to the number of shoes that are thrown, whether that number is high or low. To utilize the calculator, an individual simply input the total number of ringers that were thrown during a designated period of horseshoe pitching, as well as the total number of shoes that were thrown during that same time period.
How to Calculate Your Ringer Percentage
The calculator will automatically calculates the percentage for the pitcher. This percentage can be used to indicate whether an individual’s accuracy is increasing, steady, or decreasing within the sport. Furthermore, the percentage can be calculated over a period of time in order to compare the accuracy of a pitcher during different periods of their pitching skills.
For instance, if an individual calculates their percentage for the first and second half of a horseshoe pitching session, it will indicate whether their accuracy is increasing or decreasing over time. Another function of the calculator is the ability to utilize a target percentage feature. An individual can enter the total number of shoes that they wish to pitch in the future into the calculator, and the calculator will indicate the total number of ringers that must be thrown in order to reach the designated goal.
This feature will help an individual to understand whether the target that they have set for themself is more realistic based off their current percentage. In addition to the target percentage feature, the calculator also allow for two individuals to be compared. Each individual may have pitched a different number of shoes, but the calculator will allow them to be compared more fairly by utilizing the percentage value.
Reference tables are provided for the individual to understand what the percentage value means. For instance, regular league players commonly achieve a percentage value of the mid-teens, while higher percentages indicates a sharper form of pitching that is required for tournament play. A lower percentage suggests that an individual is still learning the sport and pitching with consistent.
However, the calculator is unable to measure factors in the sport other than horseshoe percentages. For instance, factors like the influence of the weather or the footing of the pitch may impact the percentage of the individual shoes that ring, so note of these factors should be taken with the percentage calculations. However, common mistake should be avoided.
For instance, individuals must avoid mixing the shoes and the ringers of two different individuals. Additionally, the total number of shoes pitched should not be the planned number of shoes for each individual instead of the actual total number of shoes that were pitched. By utilizing such a calculator over the course of a complete horseshoe pitching season, individuals will be able to track their season-long pitching skills.
Overall, the tool transform horseshoe pitching into an activity that can be measured, and indicate whether an individual’s skill is improving over time.
