Game Win Percentage Calculator
Track tournament game-level standings with raw GWP, adjusted floor or cap rules, draws, concessions, unfinished games, bonus game credits, and a remaining-games target record.
| Policy | Raw calculation | Floor or cap | Best use |
|---|---|---|---|
| Open standings | Wins plus half draws divided by played games | No floor, no cap | Board game leagues, local ladders, casual season tables |
| TCG tiebreak style | Wins plus one-third draws divided by played games | Minimum adjusted GWP of 33.33% | Trading card events that compare game-level strength |
| Opponent GWP style | Same raw game record, then bounded | 33.33% floor and 95% cap | Opponent-strength tiebreak audits after pairings |
| Strict win-only ladder | Only wins count in numerator; draws add no credit | No floor, no cap | Elimination pods or formats where drawn games are replayed |
| Format | Maximum games per match | Common completed range | GWP note |
|---|---|---|---|
| Best of 1 | 1 | 1 game per match | GWP mirrors match win percentage unless draws exist |
| Best of 3 | 3 | 2 to 3 games per match | Two-game wins such as 2-0 create strong differential |
| Best of 5 | 5 | 3 to 5 games per match | Longer matches smooth early variance in GWP |
| Variable rounds | Organizer-defined | Mixed completed games | Use the unfinished field to separate pending games |
| Benchmark | Example record | Raw GWP | Interpretation |
|---|---|---|---|
| Dominant | 9-1 in games | 90.00% | Usually safe for top seed comparisons |
| Top-cut pace | 8-4 in games | 66.67% | Strong, but match points and opponent record still matter |
| Middle table | 5-5 in games | 50.00% | Even game record with no differential cushion |
| Below floor | 1-5 in games | 16.67% | May be shown as 33.33% in floor-based tiebreaks |
| Standing item | Count in denominator? | Count in numerator? | Audit action |
|---|---|---|---|
| Completed win | Yes | Yes | Record as one game point before policy adjustment |
| Completed loss, concession, or forfeit | Yes | No | Include in losses even when the game was not fully played |
| Drawn game | Yes | Policy credit | Use half, one-third, or zero according to event rules |
| Unfinished game | No | No | Track separately until the organizer posts a result |
For tournaments, closeness in ranking causes tension. Match results don’t tell you much about what happend in the matches. On paper, 3 easy game wins might look the same as 3 narrow game wins. Game win percentage eliminates this noise and shows you a raw picture of who’s performing better. Simply input your stats into the calculator and let it do all the math for you. You don’t need to get bogged down with math, just concentrate on what the numbers represent.
But before I go on. First you have to know what’s what. The numerator is what’s above the line and the denominator are below it. The numerator is your total number of finished games regardless of who won, whether by concession or hard fought victory. The denominator is your total number of completed games, which includes forfeits as losses. A forfeit means you didn’t get a finish so you didn’t win either. Treating forfeits as losses prevents inflated records that don’t hold up under scrutiny. That’s why you can’t inflate records and when the truth comes out you look bad.
What Game Win Percentage Means for Tournaments
Now unfinished games are another matter. These remain outside of the equation until a final result is posted. Why? Because you don’t want to skew results with half finished games. Casuals do this all the time rushing to end rounds, which can skew the data.
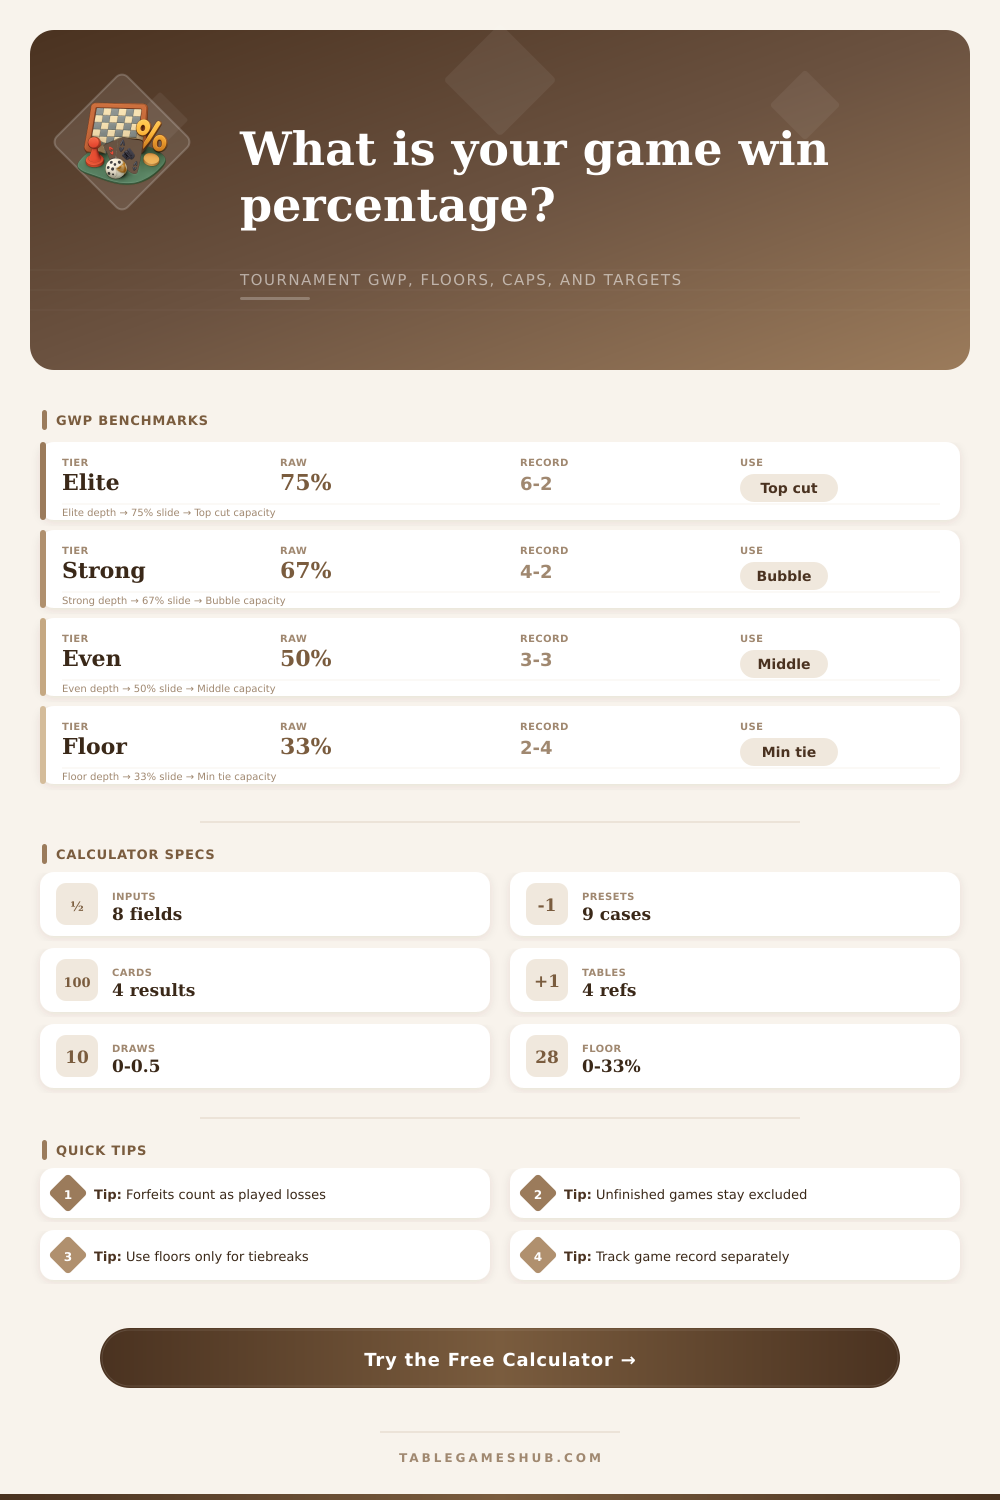
Tournaments differ based off their draws and tiebreak policies. Some tournaments award a third, some award half credit for a stalemate and some ignore it completely. You can choose which one best fits your events’ rule set. That will alter closeness of rankings based on the raw percentage. In the case of trading card games for instance, they typically have a floor of 33% to protect the ranking system from statistical oddities where players gets punished for playing bad opponents early on. These policy decisions show in our adjusted game win percentage output. Any floors or caps required by the organizer are applied there. For example, a cap at 95% prevents an untouchable competitor from completely swamping the tiebreaks. Even with lopsided raw results, the adjusted standings will feel like they’re being handled fair. Before you assume that your raw score represents everything, look up what policy your event’s using; the differences are laid out on the page so you know what standard it follows.
That’s where game differential comes into play. Pure percentages don’t tell you much about this. If we have a player who wins nine and loses one, they will have a high game win percentage. A player who wins six and loses two will look almost identical in terms of percentages but shows a wider momentum swing. The differential indicates how much they are either winning or losing by. Is there a comfortable margin, or are they just scraping by? When several players end up with the exact same game win percentage, that’s when this number can be critical. As long as the rule states that game differential should of act as a secondary tiebreaker, the person with the bigger positive difference generally have the advantage in their head-to-head comparison.
Looking forward: Projection It’s nice to know where you’re at, sure. But it’s even nicer to know what record you’d have to get in order to be a top seed. The calculator will show those target records given the number of games still to go. So if you’re at three-quarters with five games remaining, you better come away with wins from most of them to keep pace. It turns a vague feeling of worry, oh my gosh, I hope I do good… Into something real: here are some goals to aim for. Here’s a record to chase (forty-two). Or here’s a percentage that you want to hang on to (sixty-seven percent).
Tournament scorekeeping is math plus narrative. Win % is a universal language for players and tournament organizers alike. Anglers prefer to think that they are getting better. Organizers would like numbers to support pairings while avoiding contentious debates. Win % takes away some of the subjective “I was robbed” feelings and replaces them with objective data points. Splitting out game results from actual match results paints a more accurat picture of relative skill levels. Understanding how you won is just as important as winning itself. A simple win-loss tally doesn’t tell that whole story. Was it a grind or a sweep?