Power Ranking Calculator
Build table game power rankings from wins, losses, draws, scoring margin, opponent strength, recency, table finish, activity, and volatility.
PRRanking Presets
Load a tabletop league profile, then tune the result with your actual score sheet and match history.
INPlayer or Team Inputs
FXFormula Cards
Record Score
(wins + 0.5 x draws) / games
Creates the base win-rate component. A 70% record is strong, but it is still tempered by schedule and activity.
Margin Score
50 + capped(avg margin / 30) x 50
Rewards repeated scoring separation while capping blowouts so one runaway board does not distort the ranking.
Schedule Strength
50 + (opp rating - 1500) / 8
Raises rankings earned against stronger tables and lowers soft schedules without replacing the actual record.
Activity and Form
recent% - days inactive penalty
Recent results and attendance keep rankings current, especially in clubs where the field changes week to week.
SPPower Ranking Spec Grid
TBRanking Reference Tables
| Model | Record | Margin | Schedule | Recent form | Table finish |
|---|---|---|---|---|---|
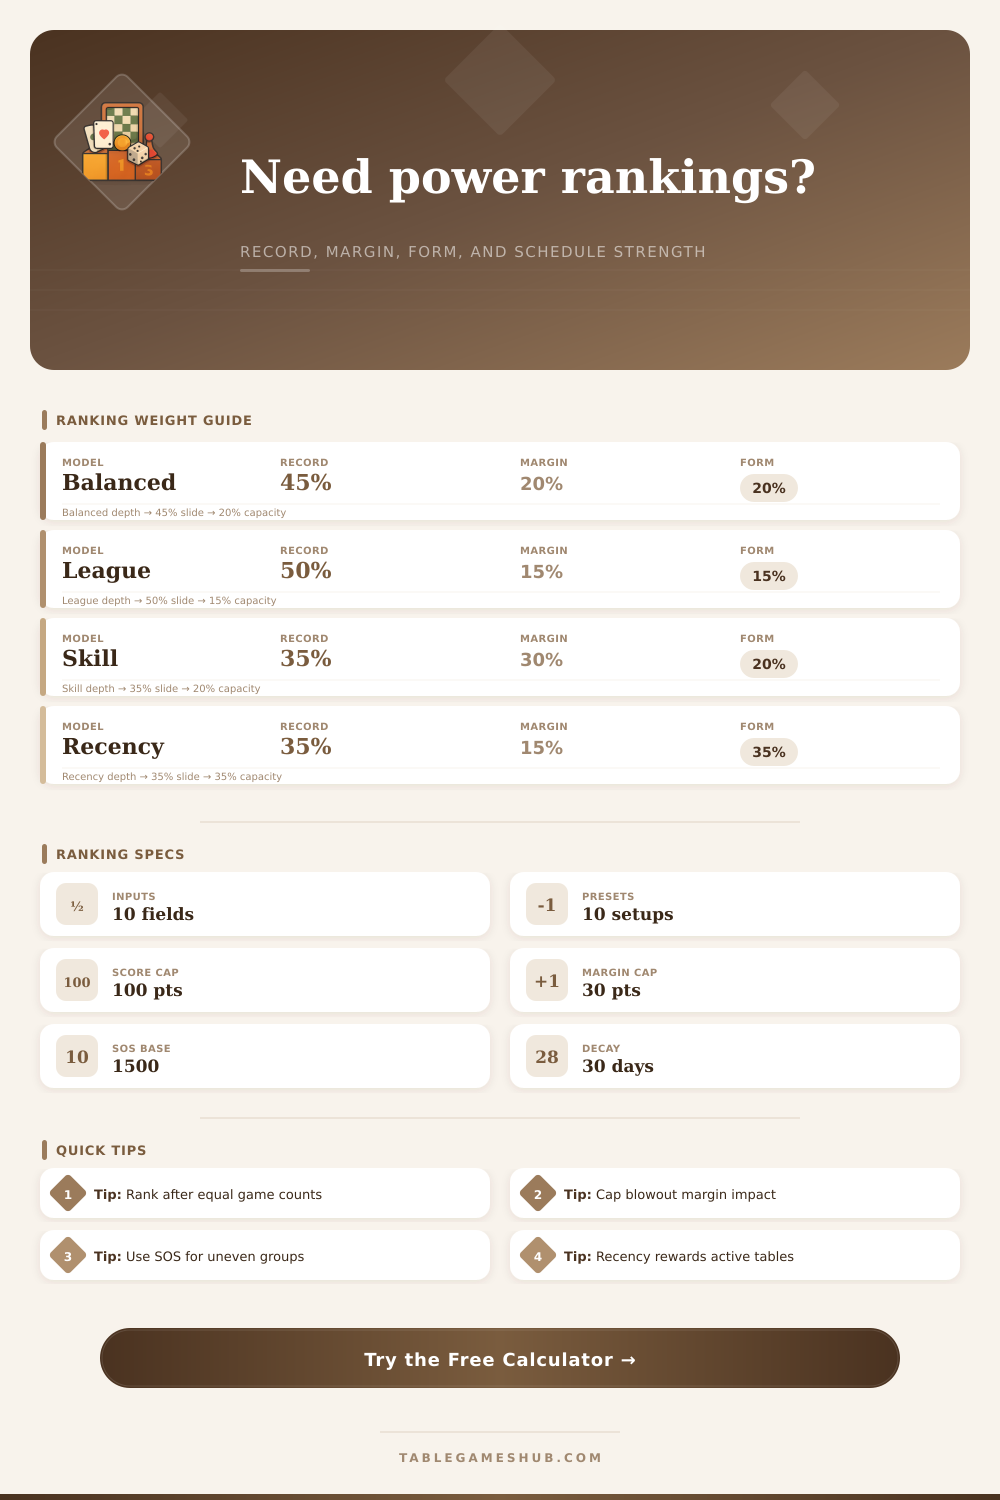
| Balanced table power | 45% | 20% | 15% | 15% | 5% |
| League standings first | 55% | 15% | 10% | 10% | 10% |
| Skill and margin heavy | 35% | 30% | 20% | 10% | 5% |
| Recent form heavy | 35% | 15% | 10% | 35% | 5% |
| Parity friendly | 40% | 10% | 25% | 15% | 10% |
| Power score | Tier label | Rank signal | Typical profile | Review note |
|---|---|---|---|---|
| 90-100 | Elite contender | Likely top seed | Wins, margin, and form all align | Check for sample size |
| 80-89.9 | Title threat | Upper table | Strong record with one soft component | Compare schedule |
| 70-79.9 | Playoff pace | Top half | Winning record or strong recent run | Watch momentum |
| 55-69.9 | Middle pack | Competitive | Mixed results, average margin | Needs separation |
| Below 55 | Chaser | Lower table | Low wins, inactivity, or tough draw | Check improvement |
| Game type | Margin factor | Finish value | Volatility note | Best use |
|---|---|---|---|---|
| Mixed board game night | 1.00 | Normal | Balances luck and skill | Weekly club tables |
| Chess, Go, abstract | 1.08 | Low | Stable head-to-head results | Ladder ranking |
| Word game club | 1.03 | Normal | Score margin carries meaning | Scrabble-style sheets |
| Tile game league | 0.96 | High | Table position matters | Mahjong, dominoes |
| Card points league | 0.92 | High | Luck can swing sessions | Multi-round cards |
| Miniatures table | 1.05 | Normal | Scenario scoring varies | Campaign standings |
| League setup | Recommended minimum | Update cadence | Primary tiebreak | Calculator focus |
|---|---|---|---|---|
| Small game night | 4 players, 6 games | After every session | Recent form | Activity and finish |
| Club ladder | 8 players, 10 games | Weekly | Opponent strength | Record and SOS |
| Round robin season | 10 players, 1 cycle | After each round | Head-to-head then margin | Record and margin |
| Open tournament series | 16 players, 3 events | After each event | Attendance then finish | Reliability and form |
TPRanking Tips
Sample size: Do not crown a new number one from two lucky tables. Use the reliability selector and wait until the field has enough shared opponents.
Margin control: Keep the margin cap on. A single blowout in Catan, Scrabble, dominoes, or a skirmish scenario should help, but not decide the whole list.
To account for this, the calculator assigns a power score to each session using their notes, factoring more then who finished first. Every win isn’t weighted equally; one won against someone new doesn’t count as much as one won against current champ. Players input average skill level of their competitors, then it tweaks rankings based off that. That means you can’t pad your stat line by picking on noobs. It gives credit to those who take on the best, even if they fall short here or there. In other words, the higher-ups knows when you’re playing good teams and the math recognizes it.
So you’ll have a winning percentage based on how hard your schedule is, not necessarily whether you were on the right end of things. We know: margin of victory matters. But only to a degree. In a game like Scrabble or Catan, a blowout means someone knows what they’re doing. But if there’s no limit on how much margin can influence, you’ll end up with an oddball game warping entire season’s rankings.
How the Calculator Works
To prevent this, we cap margin’s influence such that big wins boosts your record, but don’t drown out your wins and losses. You’ll notice preset options for various kinds of games in the interface. They’ll adjust relative weight of head-to-head vs. They will also look at how much a player win by when deciding who should rank higher.
For example, abstract games (like chess) is more consistent; the system is more confident in their binary outcome. Games of luck (card games) need a gentler touch on margin scores so that unlucky hands does not punish players too much. Realism is increased by recent form. Someone who dominated three months ago yet missed four sessions shouldn’t stay ahead of one who’s been playing well lately.
To stay relevant, the calculator assess each player with an activity decay penalty, depending on how many days since their last game. It further includes recent performance trends (typically the past five to ten results). This momentum component reward players riding a hot streak and recognizes them immediately. That’s what separates a livivng competition from a static archive.
But what model should you use? While there are some pre-set options that encompass most situations (power rating, league standings), it also offers an option to adjust based on whether you want to prioritize record and standings versus skill and margin. For example, if you’re playing a competitive game where every single point matters, go with the skill-and-margin model. If you just want to focus on who has best record without looking at margin, then choose the league-first version. These strategies will affect the balance between record, margin, form, and schedule strength. You can view exactly how each percentage gets affected by each strategy in the reference tables. I would of suggest trying a couple different models out to find which seems to be most fair for your audience.
Finally, what’s important is fairness more than precision. There isn’t any perfect formula that will capture all the nuance of each individual game night. However, if we combine scoring dominance, recency, opponent strength, and record, then we have a better approximation of actual skill than pure wins/losses ever could.
And when they say their big win proves they are number one, you have something to point at. It turns the subjective debate over bragging rights into an objective thing to talk about. It’s less about ranking players than creating a common language for talking about how they did. If the numbers tell the story well enough, the post-game discussions is both more fun and easier to resolve.