Dice Variance Calculator
Calculate dice mean, variance, standard deviation, likely swing range, target odds, and repeated-roll volatility for fair, biased, rerolled, total, highest, lowest, or success-count dice pools.
VARNamed Variance Presets
Choose a real tabletop roll pattern, then adjust dice count, sides, rerolls, targets, and scoring scale.
INDice Pool Inputs
Most Likely Result Bands
SPECDice Component and Variance Grid
FORMFour Formula Cards
E[X] = sum p(x) xThe average result after face probabilities, rerolls, modifier, and scoring multiplier are applied.Var(X) = E[X^2] - E[X]^2The squared spread around the mean. Independent totals add their individual variances.SD = sqrt(Var)The most readable swing measure because it uses the same unit as the roll result.SD total = SD x sqrt(n)Repeated independent rolls make the total less predictable by the square root of roll count.REFReference Tables
| Fair roll | Mean | Variance | Standard deviation |
|---|---|---|---|
| 1d4 | 2.5 | 1.25 | 1.12 |
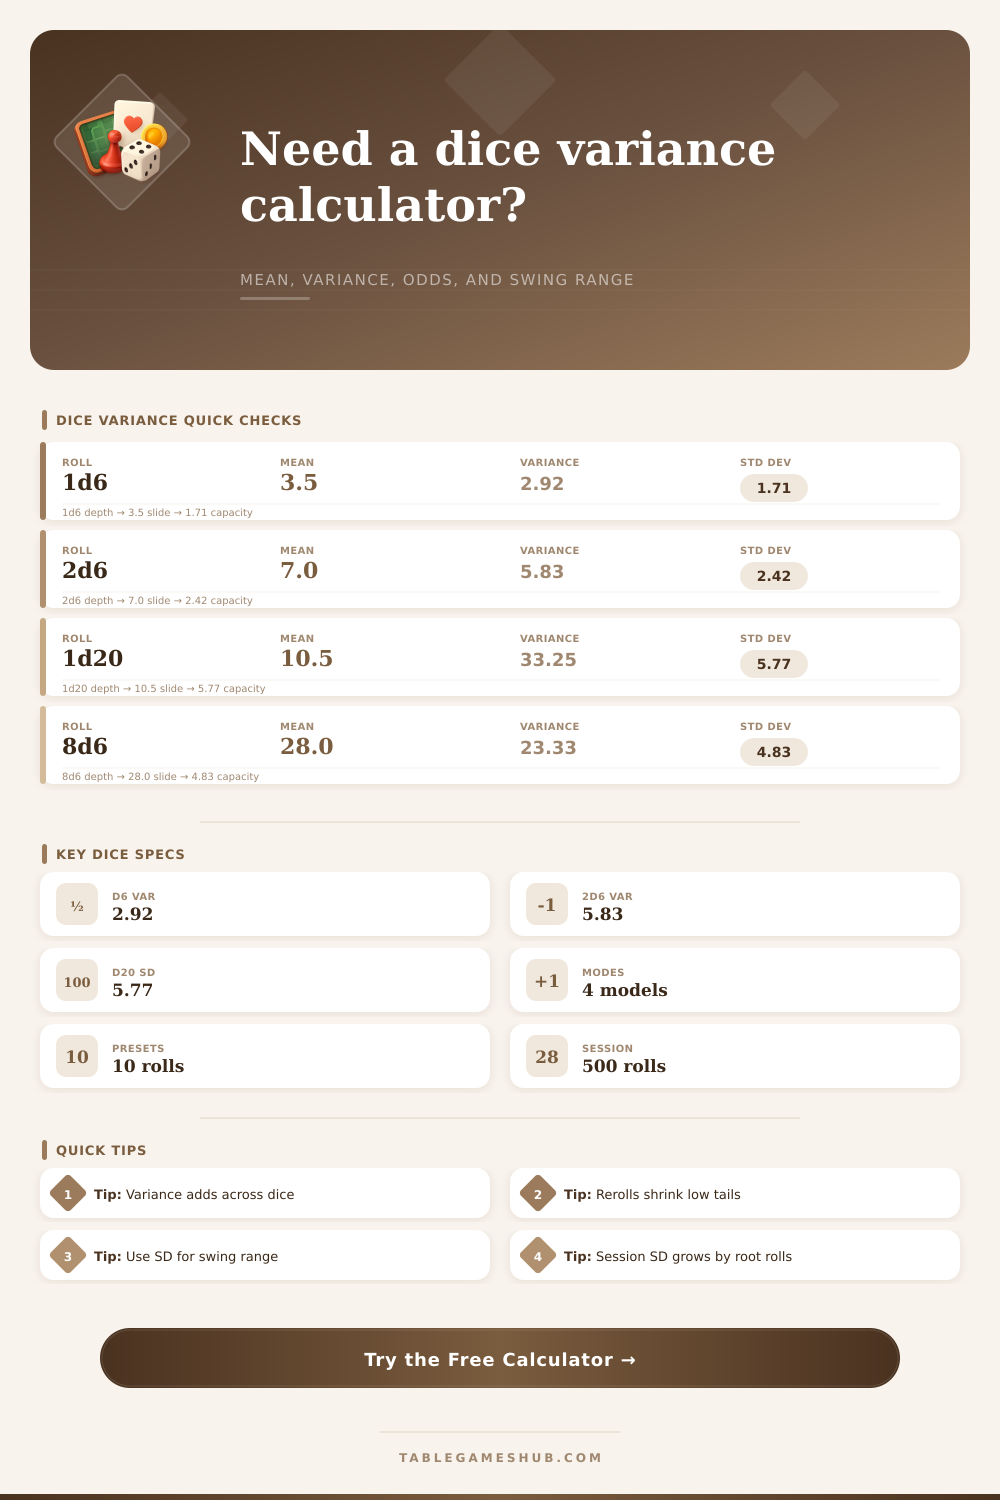
| 1d6 | 3.5 | 2.92 | 1.71 |
| 2d6 | 7.0 | 5.83 | 2.42 |
| 3d6 | 10.5 | 8.75 | 2.96 |
| 1d20 | 10.5 | 33.25 | 5.77 |
| 1d100 | 50.5 | 833.25 | 28.87 |
| Roll model | What varies | Best use | Target odds basis |
|---|---|---|---|
| Total of all dice | Sum distribution | Damage, movement, resource rolls | Chance total reaches target |
| Highest single die | Order statistic | Advantage, attack comparisons | Chance high die reaches target |
| Lowest single die | Order statistic | Disadvantage, penalty rolls | Chance low die reaches target |
| Success count | Binomial count | Dice pools with hit thresholds | Chance successes reach needed count |
| Game pattern | Typical dice | Variance note | Practical reading |
|---|---|---|---|
| Catan number roll | 2d6 total | Middle totals are much tighter | Six and eight appear more often than three and eleven |
| d20 ability check | 1d20 plus modifier | Modifier shifts mean only | Flat die stays swingy even with bonuses |
| Damage dice pool | Multiple d6 or d8 | Variance rises, relative swing falls | Large pools cluster near average |
| Success pool | Many dice, threshold hits | p(1-p) per die | Variance peaks when success chance is near 50% |
| Session size | Mean scaling | Variance scaling | Standard deviation scaling |
|---|---|---|---|
| 1 roll | Mean x 1 | Variance x 1 | SD x 1 |
| 10 rolls | Mean x 10 | Variance x 10 | SD x 3.16 |
| 100 rolls | Mean x 100 | Variance x 100 | SD x 10 |
| 500 rolls | Mean x 500 | Variance x 500 | SD x 22.36 |
TIPVariance Tips
Compare standard deviations. Variance is mathematically useful, but standard deviation is easier at the table because it is expressed in the same unit as the roll.
Separate shift from swing. A flat modifier raises or lowers the mean without changing spread, while rerolls and biased faces change both mean and variance.
You have two six-sided dice and you think, “Oh, I’m gonna get a seven.” That is because it happen most often in the middle of bell curve. Then you roll a two, followed by another low number. And then you gets a one. Your guy misses three attack in a row. What gives?
Then you start to get frustrated. You’re thinking maybe this game is against me, maybe house made mistake with the rules? Chances are, it’s something else. It is something simple. You’re on edge of what’s likely to happen. This thing that looks like chaos is actualy completely predictable. Recognizing dice variance help you stop blaming bad luck. It helps you recognize patterns instead.
Understanding Dice Variance
How far off from the mean do those numbers falls? That’s called variance. Relative to the number of sides, there’s lots of variance with just a single die. Each face are an equal possibility. You might get a one or a twenty. Twenty in one. On a twenty sided die, who knows what you’ll get? The range is massive.
If you add more dice, then tails drop away and the extremes starts cancelling each other out. Plug your dice pool into calculator above and it will do the math for you. It demonstrates that the more complex things gets, the less variance is produced. That’s why dungeon masters likes to have multiple dice for their monster damage. Every time, dragon does about the same amount of damage. It’s epic, not crazy.
Variance and mean are confused quite a bit. The variance represent the spread, or how difficult it will be to hit the target. The mean is actual location of the target. Applying a flat modifier shifts the mean without altering the variance in any way. The average outcome increase but the spread stays unchanged. This becomes important for betting on the outcome of games, or trying to design balanced encounters.
Giving someone a bonus make them stronger. But it doesn’t eliminate the possibility of getting a critical failure. The spread resists being reduced. It only responds when you alter structure of the die roll. Rerolling low faces or using advantage does that. The distribution change in specific ways because of the reroll mechanics. Getting rid of the worst outcomes by rerolling ones increase the mean and reduces the lower tail. Because we’re getting rid of the low extremes, there’s less variance (but only a little).
It’s a small thing that changes the entire feel of the game. Not only do players think the numbers is going up, they feel like the game has been made easier because the punishment from bad rolls is softened. The tool allows you to test house rules and see if they really do smooth things out, or merely shift the average.
One roll is noise. Fifty rolls are suspicious. Five-hundred rolls show what the distribution look like.
Then there’s the issue of session volatility. A session’s standard deviation increase by the square root of the number of rolls, not linearly. That means your total results becomes less volatile, per-roll, the more you play. Individual result will stop standing out in comparison to your overall results. You’ll observe the mean rising steadily rather than seeing one spike after another. Beginners believe in their anecdotes; veterans relies on the average. The anecdote exists, but it’s also an outlier.
Dice can be biased too. Biases in dice could cause more variance based off where weight falls. Dice with edges weighted will result in two peaks. And standard formulas has trouble modeling them without specific input. The vast majority of table top games use fair geometric dice. But manufacturing defects and physical wear causes tiny biases. It’s unlikely you’d want to map this out casually. Yet it would of explained why you find yourself “lucky” using one die over time. It’s not magic. They are just slightly biased towards particular faces, shifting the mean while keeping the variance high.
These are the baseline numbers laid out in the table on page so that you can easly reference them. Want to know how likely your proposed difficulty level is? Plug in those numbers and compare a typical d6 pool versus a d20 check or a complicated success-counter check. See if it’s something your group could reasonably expect to pull off or if it’s simply mathematically unlikely.
What does probability mean? It means once-in-a-while. It is not just once-in-a-while to you. It happens once-in-a-while to everyone. Over time. Knowing the range lets you work with the math instead of struggling against it. Next time you roll a couple of ones, instead of feeling angry, you’ll see variance doing exactly what it is design to do.