UNO Probability Calculator: Card Draw Odds & Chances
🎴 UNO Probability Calculator
Calculate card draw odds, hand probabilities, and action card chances in UNO
⚡ Quick Presets
ℹ️ Select a preset or fill in the form below to calculate UNO probabilities.
🎯 Calculator Inputs
🎯 UNO Probability Results
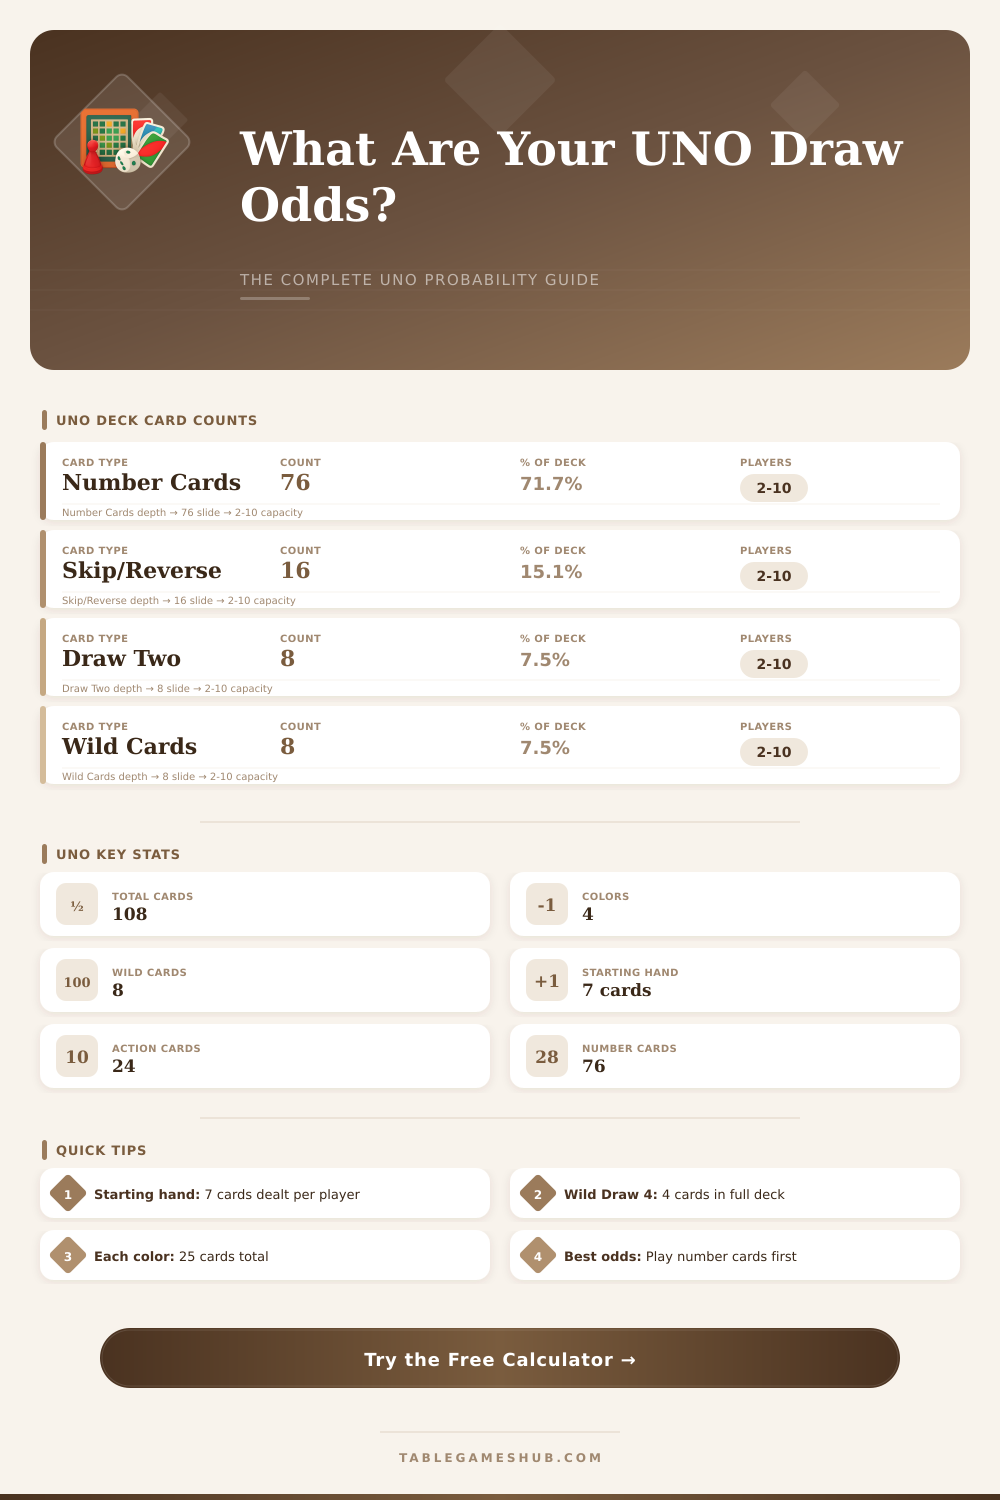
📊 UNO Deck Composition
108
Total Cards
76
Number Cards
24
Action Cards
8
Wild Cards
4
Wild Draw 4s
4
Colors
25
Cards Per Color
71.7%
Number Card %
📈 Card Type Probability Reference
| Card Type | Count (Std) | % of Deck | Draw Prob. (1 card) | Colors / Notes |
|---|---|---|---|---|
| Number 0 | 4 | 3.7% | 1 in 27 | 4 colors, 1 each |
| Numbers 1-9 | 72 | 66.7% | 2 in 3 | 4 colors, 2 each |
| Skip | 8 | 7.4% | 1 in 13.5 | 4 colors, 2 each |
| Reverse | 8 | 7.4% | 1 in 13.5 | 4 colors, 2 each |
| Draw Two | 8 | 7.4% | 1 in 13.5 | 4 colors, 2 each |
| Wild | 4 | 3.7% | 1 in 27 | No color, 4 total |
| Wild Draw Four | 4 | 3.7% | 1 in 27 | No color, 4 total |
| Any Action Card | 24 | 22.2% | 1 in 4.5 | Incl. all actions |
| Any Wild Card | 8 | 7.4% | 1 in 13.5 | Both wild types |
| Specific Color | 25 | 23.1% | 1 in 4.3 | Per color (4 colors) |
🔍 Deck Configuration Comparison
| Deck Type | Total Cards | Number Cards | Action Cards | Wild Cards | Best For |
|---|---|---|---|---|---|
| Standard UNO | 108 | 76 | 24 | 8 | 2–10 players |
| Double Deck | 216 | 152 | 48 | 16 | 6–10 players |
| No Blank Cards | 104 | 76 | 24 | 4 | Standard play |
| Action Cards Only | 32 | 0 | 24 | 8 | Fast games |
👥 Player Count & Hand Setup Reference
| Players | Cards Dealt | Draw Pile Left | Wild % Remaining | Avg Game Time |
|---|---|---|---|---|
| 2 | 14 | 93 | 7.5% | 15–20 min |
| 3 | 21 | 86 | 7.5% | 20–30 min |
| 4 | 28 | 79 | 7.5% | 25–35 min |
| 5 | 35 | 72 | 7.5% | 30–45 min |
| 6 | 42 | 65 | 7.5% | 35–50 min |
| 8 | 56 | 51 | 7.5% | 45–60 min |
| 10 | 70 | 37 | 7.5% | 60–90 min |
💡 Probability Tips
📌 Starting Hand Odds: With a 7-card starting hand from a 108-card deck, the probability of getting at least one wild card is approximately 39.6%. This uses the hypergeometric distribution: P = 1 — C(100,7)/C(108,7).
📌 Color Distribution: Each of the 4 colors (Red, Blue, Green, Yellow) contains exactly 25 cards: one 0, two each of 1–9, two Skips, two Reverses, and two Draw Twos. That is 23.1% of a standard 108-card deck.
📌 Action Card Timing: Action cards make up 22.2% of the standard UNO deck. As the game progresses and cards are discarded, the probability of drawing an action card changes. Track the discard pile to estimate remaining odds.
📌 Draw Pile Depletion: With 4 players each dealt 7 cards, only 79 cards remain in the draw pile at game start. For 10 players the draw pile drops to 37 cards, significantly increasing the probability of reshuffling the discard pile mid-game.
Uno is a card game that existed since 1971. The main task is remove all your cards before the other players. Even so under that simple look hide enough math secrets, especially about chances and Probability.
A standard pack of Uno stores 108 cards. They split between four colours, each with 25 cards. Besides that, are 24 action cards, 4 draw-fours and 4 wild cards.
Uno: Chances, How Long Games Last, and Rules
Like this, for sample the chance to pull a green card match to the ratio of green cards shared by the whole number of remaining cards.
Here a funny way to think about that. Assume that we have 108 cards, and every player receives 7 from them. What are the chances to receive a card, whose copies in the whole pack limit to only 4?
Such questions commonly appear during thinking about Probability in Uno. Clear math pointed, that between three players the chance, that some from them receive exactly three from the four sepcial cards during the deal, are around 1 from 451. This is very small.
When a player stays with only one card and cries “Uno”, the math becomes tough. The Probability in that moment depends on the amount of cards in the pack. When your hand has only one and the pack is still full, the chance to pull exactly the right card too end the game stay low; around 5.9% according to one sample.
Now look at what happens in a real game. On average, a game lasts from 63 until 64 turns. So for four players each receives about 16 turns.
However the spread is not same. Some games end very quickly, the fastest only after 16 turns. Others stretch for a long time.
The spread of game lengths seems standard, so the most bunch around the average, although some big values exist in the long side.
Strategy also matters. Usually one plays first the average number cards, later the special, and saves the wild and draw-fours for the finish. That order commonly fits with the natural way, as many folks play the game.
There are various house rules that change things. In one version one pulls cards until you find a match. Others need only one pull, play it if it fits and keep it otherwise.
Stacking is another commonly used rule, if someone lays a draw-two, the next can push another up, passing the penalty down. But draw-fours you cannot stack on draw-twos or the other way around. The chance to win without ever pulling extra cards would be very low, because a player would need right cards each time toescaoe the draw-twos of opponents and the wild draw-fours.
