Cornhole PPR Calculator for Player Stats
Cornhole PPR Calculator
Compare bags thrown, total points, rounds, airmail percentage, on-board percentage, PPR, DPR, efficiency trend, and head-to-head player stats.
🎯Presets
⚙️Stat Inputs
One round is one turn of four bags for the tracked player.
Count clean hole-in bags without board contact.
Count bags left on the board, not bags in the hole.
Enter round scores separated by commas, spaces, or new lines. The calculator uses this for the efficiency trend.
Cornhole stat result cards
Player A PPR
7.25
points per round
DPR
+1.00
differential per round vs Player B
Airmail / On-board
15.6% / 65.6%
clean holes and board bags
Efficiency Trend
+1.0
last half vs first half
📌Current Stat Grid
32
Bags Thrown
58
Total Points
60.4%
Point Efficiency
A +8
Player Comparison
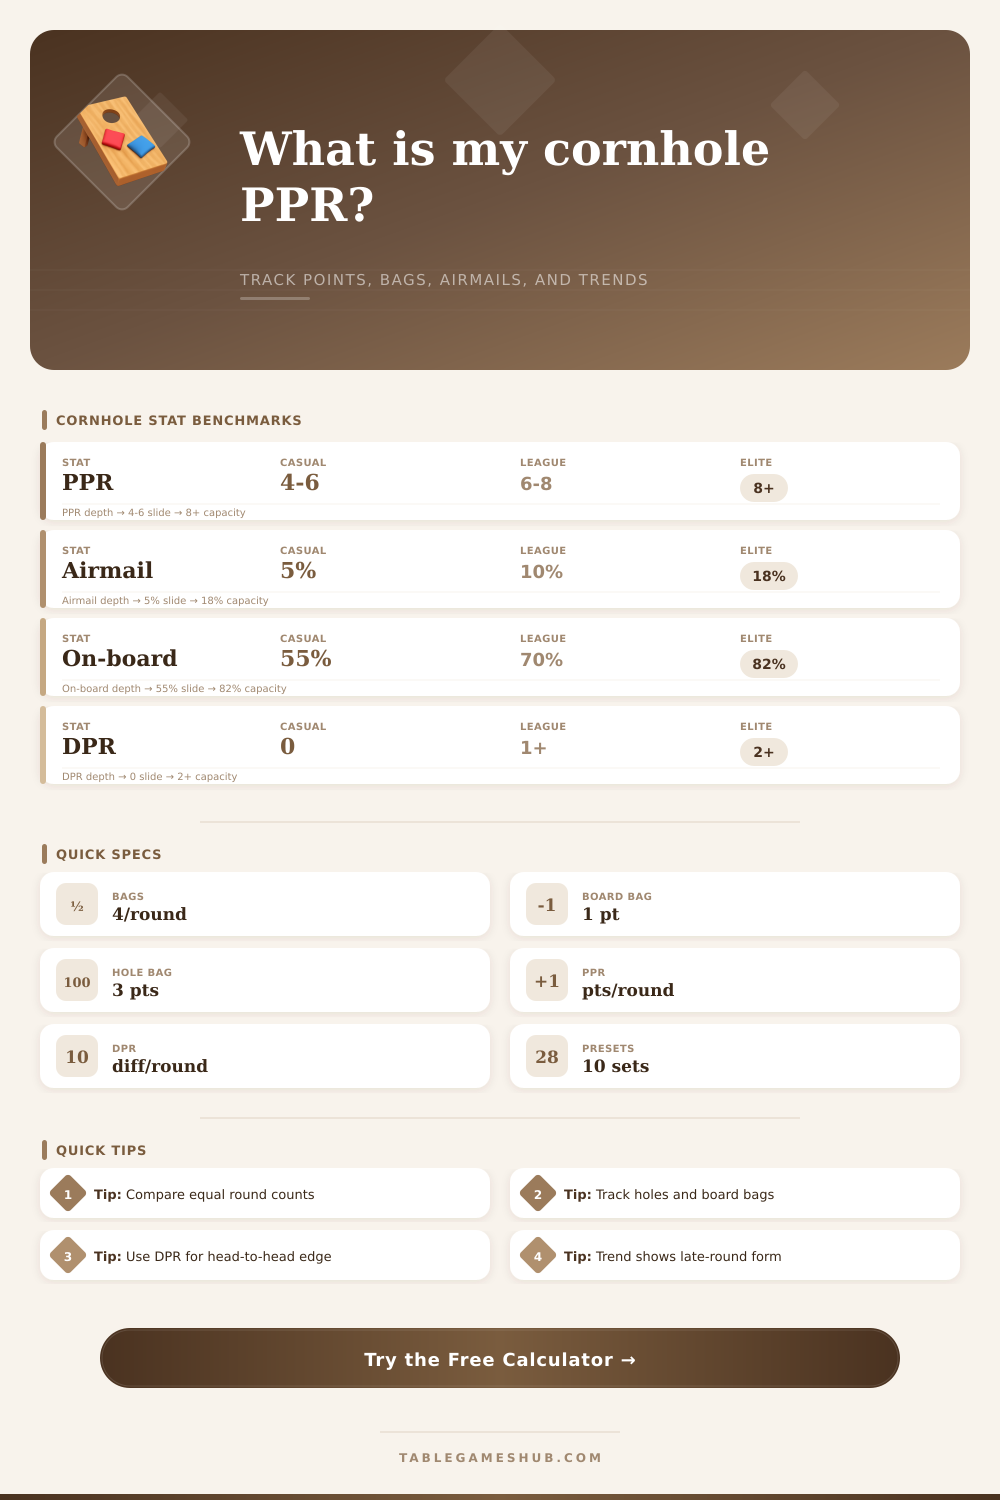
📊PPR Reference Tables
| PPR Range | Read | Typical Bag Result | Use |
|---|---|---|---|
| 0 to 3.9 | Developing | Misses are still common | Short samples, new players |
| 4.0 to 5.9 | Casual steady | One to two scoring bags | Backyard tracking |
| 6.0 to 7.9 | League strong | Board control with holes | Competitive match notes |
| 8.0+ | High pressure | Frequent 8 to 12 rounds | Elite pace comparison |
| Hit Mix | Formula | Good Sign | Watch For |
|---|---|---|---|
| Airmail % | Airmails / bags | Clean scoring power | Low board support |
| On-board % | Board bags / bags | Bag control and safety | Low conversion to holes |
| Scoring bag % | (Airmail + board) / bags | Few wasted throws | Blocks without points |
| Point efficiency | Points / max points | Higher value per bag | Inflated short samples |
| Comparison Output | Meaning | Formula | Best Use |
|---|---|---|---|
| PPR | Player scoring pace | Total points / rounds | Individual rating |
| DPR | Head-to-head edge | (A points - B points) / rounds | Match pressure |
| PPB | Bag value | Total points / bags | Uneven bag counts |
| Trend | Late form | Late PPR - early PPR | Fatigue or comeback |
| Round Pattern | Example Log | Trend Read | Calculator Note |
|---|---|---|---|
| Hot finish | 4, 5, 8, 9 | Positive | Late form improved |
| Flat session | 6, 7, 6, 7 | Stable | Repeatable pace |
| Fade | 9, 8, 5, 4 | Negative | Late rounds slipped |
| Noisy sample | 2, 10, 3, 9 | Variable | Use more rounds |
💡Tips
Keep bag counts clean: PPR assumes the tracked player threw the same number of bags per round. If a match ends early, enter the actual bags thrown and rounds completed.
Use DPR for comparison: PPR tells you how Player A scored. DPR shows whether that scoring pace actually created separation against Player B.
Cornhole is a game in which the player earns points by throwing the bags toward the board; the player improve at the game by successfully getting the bags on the board more often than the player misses the board. While many people play the game for fun, many people play cornhole competitively. Although a person may feel that they are playing good at the game, that feeling isnt an accurate measurement of how well that player is performing.
A measurement of the player’s performance at the game can be obtained by tracking the player’s points scored per round. By tracking the player’s points per round, the player can observe whether they are actually improving at the game, or whether they are simply having a lucky streak in there bag throws. To calculate the player’s points per round, the total points that a player score during a game is divided by the total number of rounds that the player completed during that period of play.
How to Track Your Cornhole Scores and Stats
The result of dividing the total points scored by the total number of rounds played will reveal the average number of points that the player scores each time that they throw four bag. For instance, a casual player of cornhole may score a medium number of points per round; however, a player who compete in a cornhole league will score a higher number of points per round due to the player’s improved ability to get the bags on the board. While a player may not experience a high difference in their points scored per round within a single night of playing, a player that tracks their points scored per round will experience a large difference over many playing session.
While the points per round for a player is one statistic that can be gathered using the calculator, it is also valuable to track the player’s differential per round. The differential per round is calculated as the difference between the player’s points per round and the opponent’s points per round. For example, if a player scores seven points per round and their opponent score five points per round, the player’s differential per round is two points.
This differential per round is a valuable statistic for measuring the player’s actual difference in performance relative to that of their opponent. It is also helpful for the player to use a calculator to calculate this statistic, as the calculator ensures that the player does not have to perform mental arithmetic to calculate the difference, and avoids possible mistake made when the player is tired after playing for many rounds. In addition to calculating the player’s differential per round, it is also helpful for the player to track their airmail percentage and on-board percentage.
An airmail is a bag that lands in the hole without touching the board; scoring an airmail provide the player with a high score for that round, but carries the risk of missing the board with the bag. An on-board bag is one that lands on the board itself. Airmail and on-board percentages can provide a player with insight as to whether they choose to score airmails or on-board bags in their games.
The calculator tracks both of these percentage to provide a player with insight as to the origin of their scoring at the game. Another valuable statistic to track for a cornhole player is the player’s trend in performance. Trend statistics allow a player to understand whether their performance in the game is steady, improving, or fading after many rounds of play.
For example, some players may score high percentages of points per round at the beginning of a game, but fade to lower percentages of points per round as they continue to play; other players may score lower percentages of points per round at the beginning of a game, but increase their scoring percentage as the game continues. By logging each round of score for each player, an opponent can compare their scores to those of the player using the calculator to determine whether there are any trend in performance. These reference tables help a player to more thoroughly understand their performance during the game.
The tables provide context to the statistics provided to the players by separating the performance of cornhole players who are developing their pace to play the game to those who score a high number of points per round and play at a league pace. By understanding where a player’s number fall within these reference tables, the player can establish goals for their future performance. These tables also reveal what an airmail percentage and on-board percentage for players who exhibit certain skills within the game.
This helps to avoid incorrectly assuming that a high airmail percentage is always a positive attribute for that player. The quality of opponents that a player faces during games is a factor in their performance that cannot be calculated by the statistics provided to players. For instance, scoring a total of seven points per round against a weak opponent is not the same as scoring seven points per round against a strong opponent.
Consequently, the differential per round is one of the more valuable statistics for players to track. Additionally, players should also enter the actual number of bags that a player throw into the game; most players will score four bags per round, but the number of bags may change during specific match. Therefore, entering the actual number of bags that a player throws into the game ensures that a player’s percentage are accurate.
By tracking each of the statistics described above, a player will naturaly improve at the game faster than players who only use their memory to track their performance. By keeping track of each of these statistics, a player will notice improvement in their performance at the game; a player may discover, for instance, that scoring a high number of airmails result in lower points per round. Players can also identify the number of on-board bags that they must score to improve their differential per round.
Using these statistics gathered over many rounds of play will allow a player to recognize any change in their performance. Furthermore, having these statistics will allow a player to talk to their practice partners about their performance at the game. For instance, a player can tell their practice partner their current pace of scoring points per round, or their target pace that they wish to achieve.
A player can easily record all of this information after each game.
