Cricket Bowling Economy Calculator – Analyze Your Figures
🏏 Cricket Bowling Economy Calculator
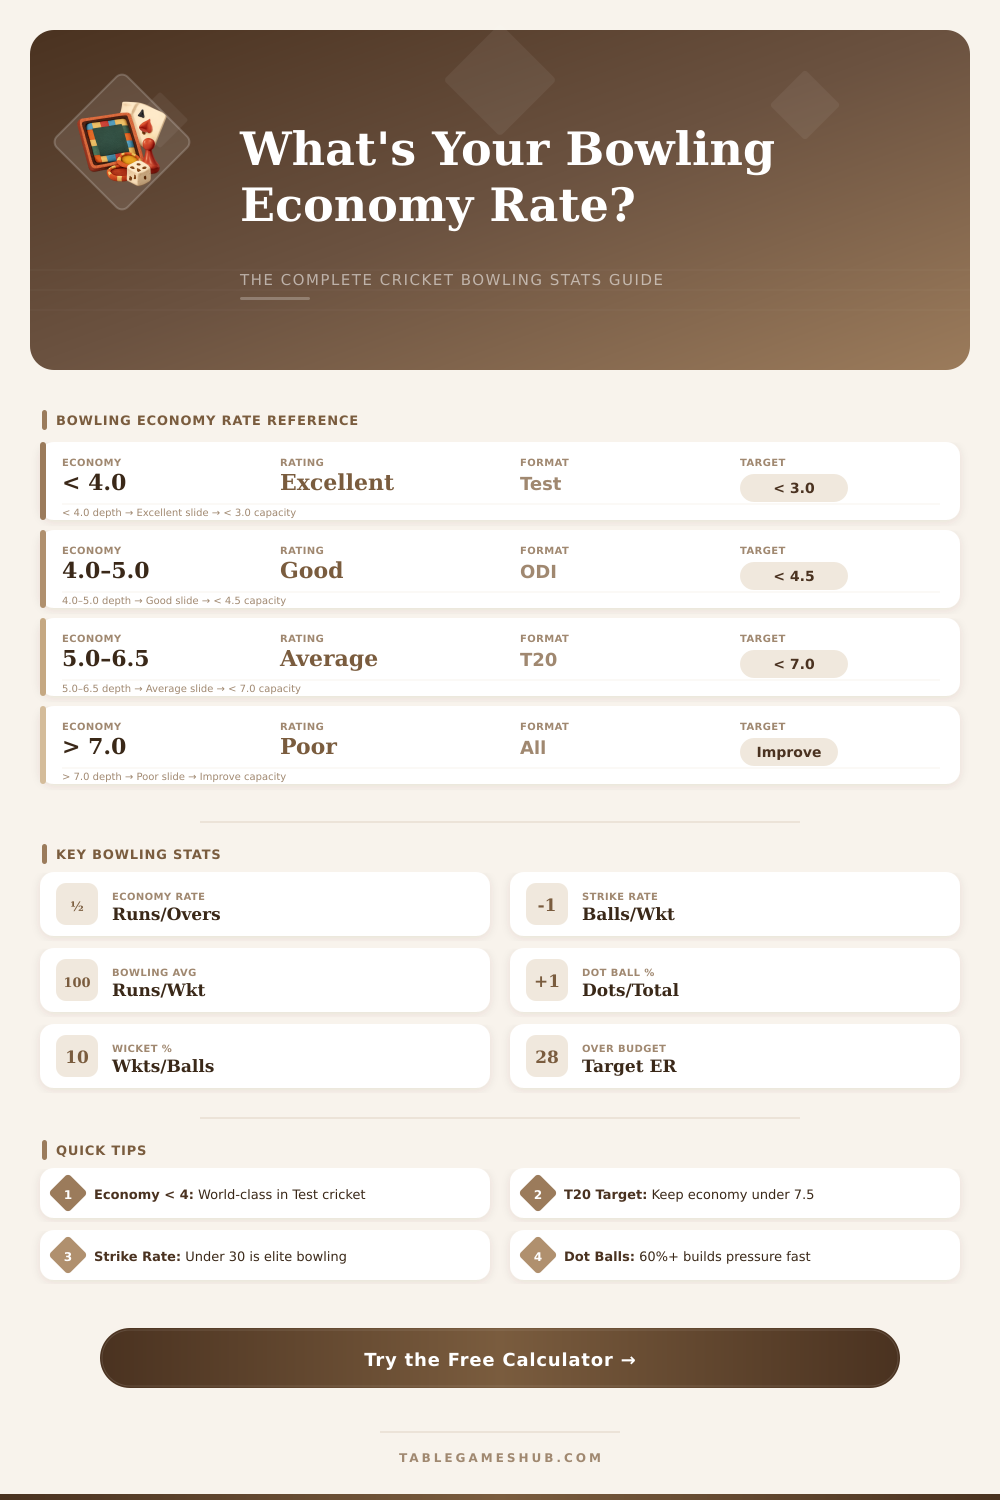
Calculate economy rate, strike rate, bowling average, dot ball % & more for any format
⚡ Quick Presets
📊 Bowling Figures Input
🏆 Bowling Analysis Results
📋 Key Bowling Benchmarks
3.0
Elite Test Economy
4.5
Good ODI Economy
7.0
T20 Target Rate
25
Elite Strike Rate
20
World-Class Avg
60%
Good Dot Ball %
6
Max Balls/Over
10
ODI Max Overs/Bowler
📈 Economy Rate Standards by Format
| Format | Excellent | Good | Average | Poor | Max Overs/Bowler |
|---|---|---|---|---|---|
| Test Match | Unlimited | ||||
| ODI (50 overs) | 10 overs | ||||
| T20 | 4 overs | ||||
| T10 | 2 overs | ||||
| The Hundred | 20 balls (3.3 ov) |
🏋 Bowling Strike Rate & Average Guide
| Rating | Strike Rate (balls/wkt) | Bowling Average | Example Bowlers | Format Context |
|---|---|---|---|---|
| Under 20 | Under 18 | Warne, Murali, Anderson | All formats | |
| 20 – 30 | 18 – 25 | Top international | Test / ODI | |
| 30 – 45 | 25 – 33 | Regular international | ODI / T20 | |
| 45 – 60 | 33 – 45 | Domestic / club level | All formats | |
| Above 60 | Above 45 | Developing bowlers | Amateur |
📐 Format Quick Reference Data
| Format | Total Overs | Balls per Match | Target Team Score | Bowlers Used |
|---|---|---|---|---|
| Test Match | Unlimited | 450+ per innings | 200+ per innings | 5 – 6 typically |
| ODI | 50 per side | 300 per innings | 250 – 350 | 5 – 6 |
| T20 | 20 per side | 120 per innings | 150 – 200 | 5 – 6 |
| T10 | 10 per side | 60 per innings | 90 – 130 | 5 typically |
| The Hundred | 100 balls/side | 100 per innings | 130 – 160 | 5 – 6 |
💡 Economy Rate Formula: Economy Rate = Total Runs Conceded ÷ Total Overs Bowled. A rate under 4.0 in Test cricket is considered world-class, while in T20 cricket anything under 7.0 is solid. Partial overs are counted as decimals (e.g. 3.4 overs = 3 full + 4 balls = 22 balls total).
🎯 Bowling Average vs Economy: Bowling average (runs per wicket) measures cost of each wicket, while economy measures runs per over. A great all-round bowler has a low average AND low economy. Strike rate (balls per wicket) below 30 is considered elite in Test match cricket.
The economy in Cricket estimates how many points flow for each ball, genuinely it ranks between the most telling statistics for estimating whether a bowler does his role. The less big that value the more well. Bowlers that keep tight economy are those that limit the attack of the batsmen, score more key and leave batsmen in constant worry.
The calculation for that is easy. One shares the whole score given up by means of the amount of overs bowled. For instance, if a bowler allows 32 points during 4 overs, that gives 8.00 points each over.
Bowling Economy in Cricket
Or if some limit to only 3 points in one single over, so 3.00 economy. Here it is.
Here the spot where many folks mix everything: the average of overs and the economy is not the same in every case. The average of overs considers points given up for each taken wicket. Bowling Economy so is only points shared by means of overs.
A bowler can have great average, they chase wicktes, yet leave runs between the gaps. The best bowlers reach both measures, but in shorter game types economy genuinely matters.
There is also another way to count that, that can surprise. Take the average, share it by means of the striking rate, later multiply by means of 6 and you find the economy. Like this, if two bowlers have almost same averages, that with the low striking rate will show better economy.
That tie between the three values genuinely matters too understand, because it becomes clear when one observes it.
In the early era of day games in Cricket, the 1970s until the late 1980s, economy above 4.2 was seen as expensive. Everything changed strongly. The current Cricket evolved to another level.
Batsmen improved their striking reflex, especially in the final overs, what makes it genuinely more challenging for bowlers to control the situation. Add the two-ball rule in ODIs and the reverse swing disappears early, what hits the fast bowlers even more hard.
In test Cricket the causes work otherwise. The average of overs and the striking rate has priority, because teams need 20 wickets to win. Economy helps, of course, but it is not the main focus.
Pass to limited-over games and sharply economy becomes key, because in the end, points not allowed are likewise precious as points gained, no?
When one gives prizes based on the results of bowlers, they must bowl at least 2 overs to enter the ranking. If two bowlers match in economy, that with more overs ranks more highly. Even if they still match?
Then the biggest number of wickets inthat match settles the tie.
