
Win Probability Calculator: Calculate Your Odds Instantly
🎲 Win Probability Calculator
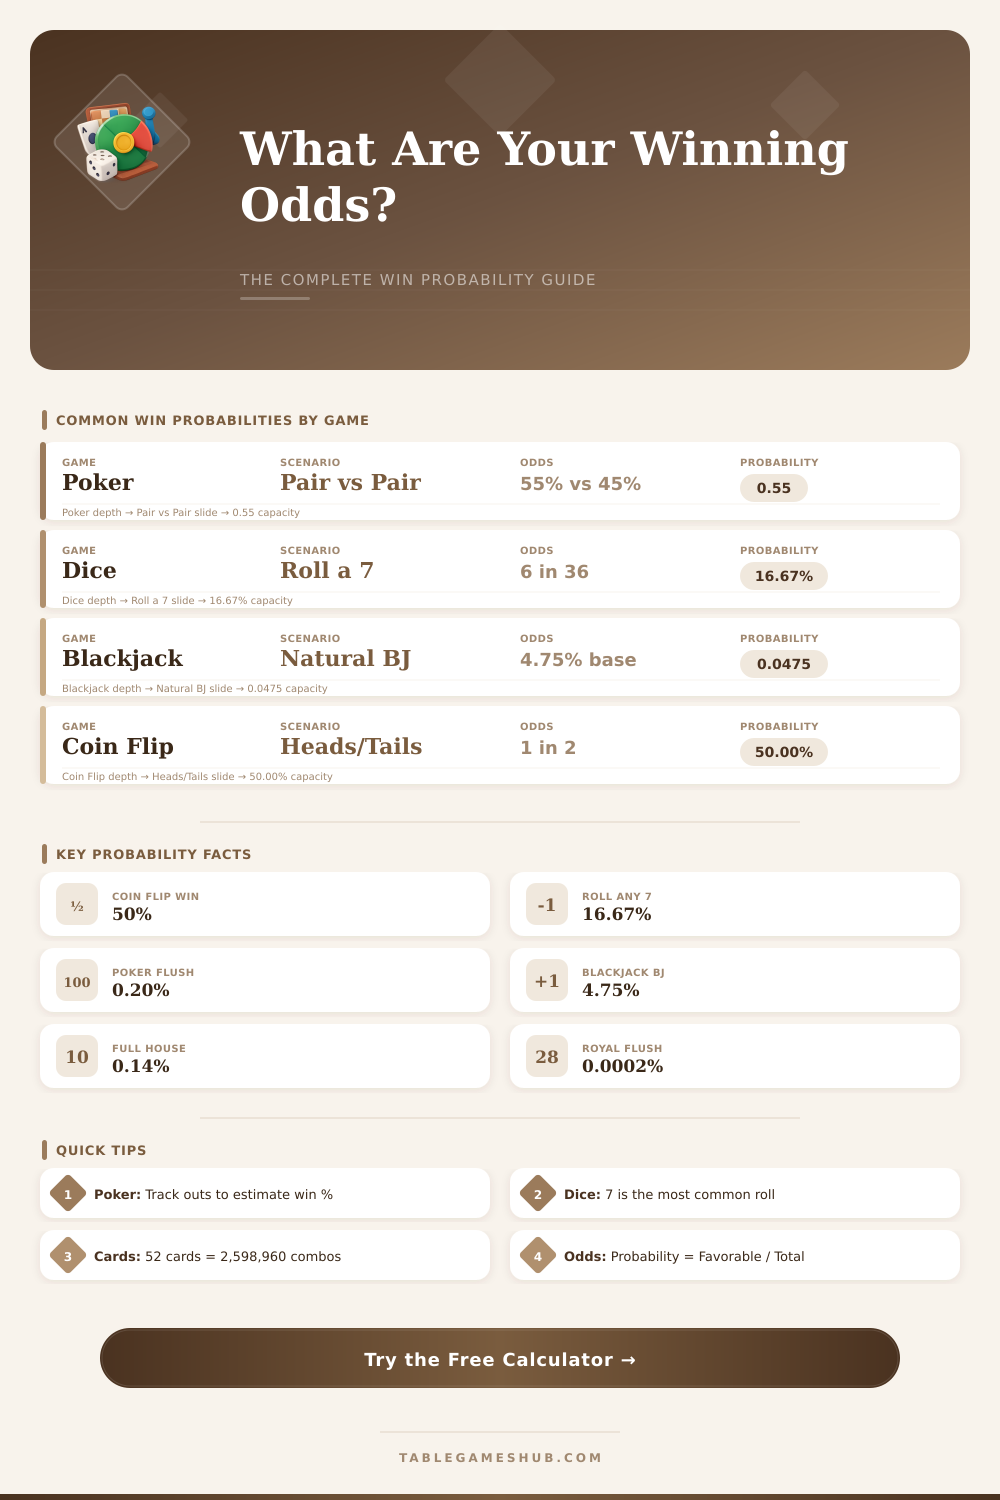
Calculate exact winning odds for poker, dice, card games & more — instant, accurate results
⚡ Quick Presets
🔧 Calculator Settings
🎯 Your Win Probability Results
📊 Probability Quick Reference
50%
Coin Flip Win
16.67%
Roll a 7 (2d6)
4.75%
Blackjack Natural
0.0015%
Royal Flush (5-card)
35%
Flush Draw (2 cards)
31.5%
Straight Draw (8 outs)
55%
Pocket Pair vs Pair
2,598,960
5-Card Combos (52-deck)
🃏 Poker Hand Probabilities (5-Card Draw)
| Hand | Combinations | Probability | Odds Against |
|---|---|---|---|
| Royal Flush | 4 | 0.000154% | 649,739 to 1 |
| Straight Flush | 36 | 0.00139% | 72,192 to 1 |
| Four of a Kind | 624 | 0.0240% | 4,164 to 1 |
| Full House | 3,744 | 0.1441% | 693 to 1 |
| Flush | 5,108 | 0.1965% | 508 to 1 |
| Straight | 10,200 | 0.3925% | 254 to 1 |
| Three of a Kind | 54,912 | 2.1128% | 46.3 to 1 |
| Two Pair | 123,552 | 4.7539% | 20 to 1 |
| One Pair | 1,098,240 | 42.2569% | 1.37 to 1 |
| High Card | 1,302,540 | 50.1177% | 0.995 to 1 |
🎲 Dice Probability Reference (2d6)
| Sum | Combinations | Probability | Odds Against |
|---|---|---|---|
| 2 (Snake Eyes) | 1 | 2.78% | 35 to 1 |
| 3 | 2 | 5.56% | 17 to 1 |
| 4 | 3 | 8.33% | 11 to 1 |
| 5 | 4 | 11.11% | 8 to 1 |
| 6 | 5 | 13.89% | 6.2 to 1 |
| 7 (Most Common) | 6 | 16.67% | 5 to 1 |
| 8 | 5 | 13.89% | 6.2 to 1 |
| 9 | 4 | 11.11% | 8 to 1 |
| 10 | 3 | 8.33% | 11 to 1 |
| 11 | 2 | 5.56% | 17 to 1 |
| 12 (Box Cars) | 1 | 2.78% | 35 to 1 |
🂡 Blackjack Probability Reference
| Scenario | 1 Deck | 6 Decks | Notes |
|---|---|---|---|
| Natural Blackjack (Player) | 4.827% | 4.745% | Ace + 10-value card |
| Dealer Busts | 28.36% | 28.58% | Depends on up-card |
| Player Wins (overall) | ~43% | ~42.2% | Basic strategy assumed |
| Push (Tie) | ~8.5% | ~8.5% | Varies by rules |
| House Edge (basic strategy) | 0.5% | 0.64% | S17 rules |
| 10-value cards in deck | 16/52 | 96/312 | 30.77% of shoe |
🪙 Poker Outs Reference
| Draw Type | Outs | 1 Card % | 2 Cards % |
|---|---|---|---|
| Flush Draw | 9 | 19.1% | 35.0% |
| Open-Ended Straight | 8 | 17.0% | 31.5% |
| Two Overcards | 6 | 12.8% | 24.1% |
| Gutshot Straight | 4 | 8.5% | 16.5% |
| One Overcard | 3 | 6.4% | 12.5% |
| Pocket Pair to Set | 2 | 4.3% | 8.4% |
| Runner-Runner Flush | ~ | N/A | 4.2% |
💡 Rule of 2 and 4: In Texas Hold'em, multiply your outs by 2 for one card to come (approximate %), or by 4 for both turn and river. Example: 9 outs x 4 = 36% chance of hitting your flush draw by the river.
🎯 Understanding Odds vs Probability: If your win probability is 25% (1 in 4), your odds against winning are 3 to 1. To convert probability to odds against: (1 - P) / P. A 50% chance = 1 to 1 odds (even money). Always compare pot odds to hand odds to make profitable decisions.
Winning probability works as a tool that points the chance that a sporting team will win at any moment of a match. It bases itself on study of past events, when teams found themselves in similar spots. The hard part is made up of picking what parts of the situation truly weigh during that type of game.
Imagine it this way. When two identical teams play on neutral ground, each starts with 50 percent chance to win. During the game progress, that value adjusts based on the events.
How Winning Probability Works in Sports
In football the percentages range from 0 what shows no hope, to 100 what means sure triumph.
In baseball, the state of the game plays a big role. Is the team home or away, the current score, amount of outs and even position of the runners on bases (everything affects the numbers). The Added Winning Probability, or WPA, measures how far one single action in the game changes the chances of the team.
It simply gives value to the weight of one play in the whole pictrue of the match.
You can count winning probabilities for many kinds of sports. Among them is NBA, MLB, NHL, NFL, college football, college basketball, tennis, MLS, the Premier League, The Tie and Liga MX. ESPN shows updated winning probability during the games.
When things happen like scoring of points or a missed shot, the number updates in real time.
One new fun thing for folks is watching the chart of winning probability after a wild game. Back and forward movement or thrilling returns make the chart full of huge changes. For example, in a college basketball match between UConn and Syracuse, UConn had a 96.7 percent chance to win with only more then three minutes left.
Some fans make charts for every game through a whole NFL season, to see how the years of every team changed.
Of course, folks wonder when a team with 95 percent winning probability ends up losing. That does not prove that the model failed. It simply shows that rare events do happen.
A 95 percent chance leaves enough space for a surprising result. Folks often have trouble with that idea.
There are also studies about how that model works for football especially. The final difference of victory in an NFL game can be valued by means of normal random numbers. The average bases on the Las Vegas line, with standard deviations between 13 and 14 points.
In one case, six different models all favored Oakland against the Dallas Cowboys with around 2-against-1 odds, typical winning margin of 4.7 points and 65.9 percent winning probability.
Even in electronic sports, winning probability is used. At the World Championship of League of Legends, a stat called Winning Probability compares the present game state with prior matches, using things like differences in gold, time ofgame and which team is on that side.
