
Table Tennis Rating Calculator – Track Your ELO & Progress
🏓 Table Tennis Rating Calculator
Calculate Elo rating changes, expected scores, K-factor & multi-match rating progressions
⚡ Quick Presets
⚙️ Rating Calculator Settings
Unit System (for table dimensions reference)
🏓 Match Details
🏆 Your Rating Results
📊 Rating Level Reference Grid
1500
Default Start
ITTF Starting Elo
2900+
World #1 Rating
Fan Zhendong peak
K=32
Club K-Factor
Most common value
400
Elo Scale Factor
Standard divisor
~95%
Win Prob at +400
Rating gap = 400 pts
50%
Win Prob Equal
Same rating players
11
Points per Game
ITTF rules (deuce 10)
4
Games to Win
Best of 7 format
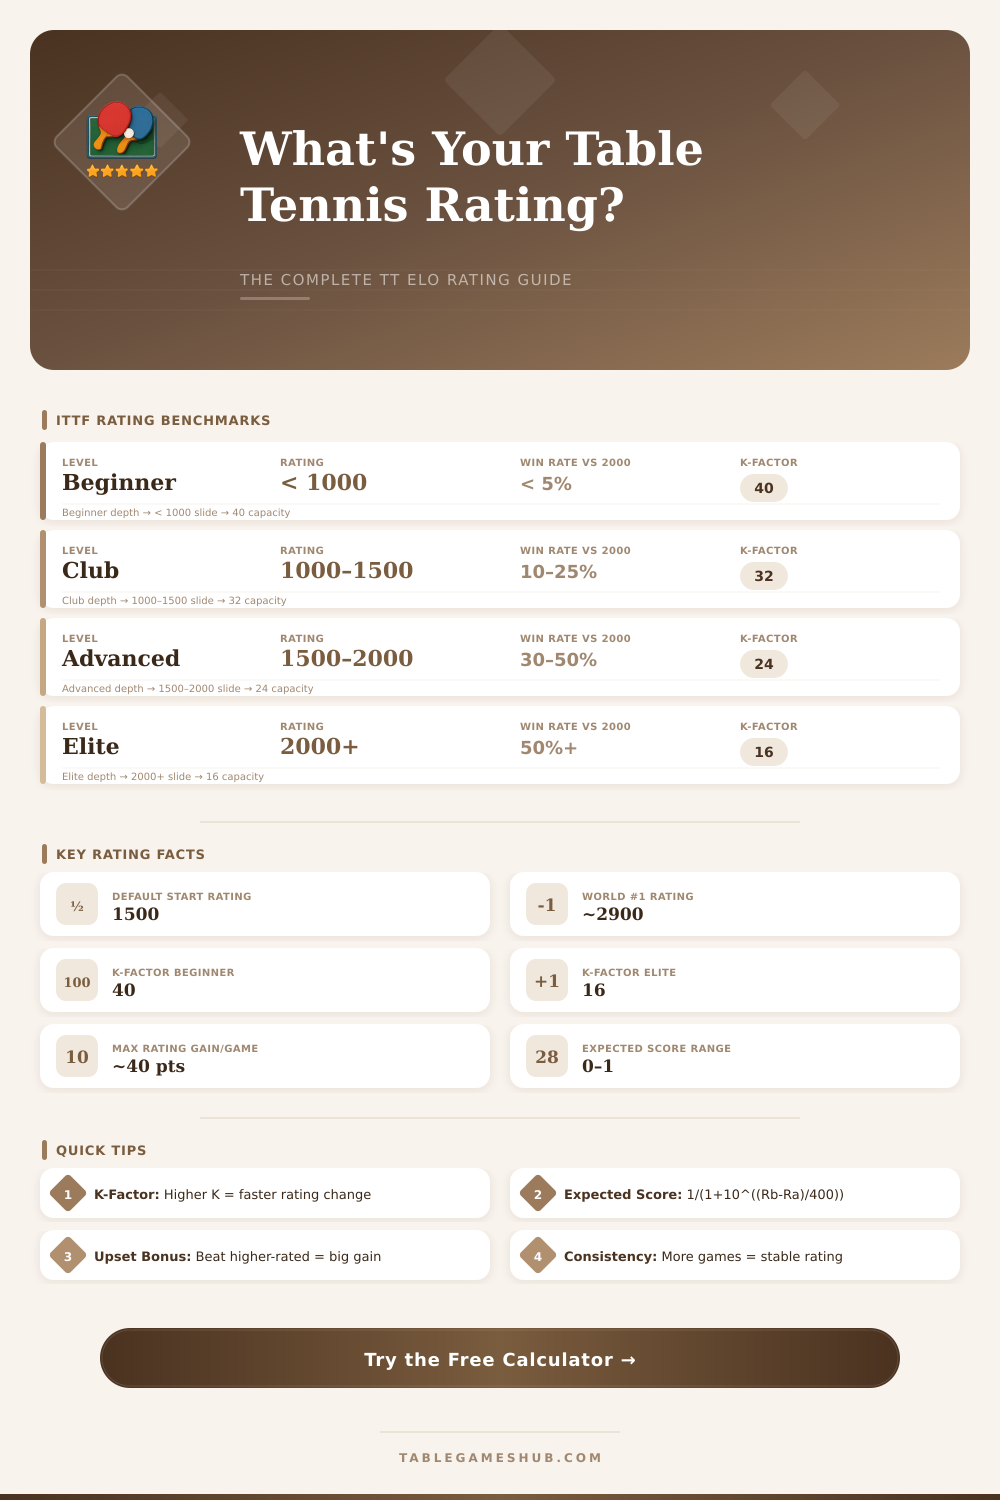
📈 Elo Rating Benchmarks by Level
| Level | Rating Range | Win vs. 2000-rated | K-Factor | Est. Training (hrs/wk) |
|---|---|---|---|---|
| Beginner | < 1000 | < 2% | 40 | 1–3 |
| Recreational | 1000–1300 | 2–8% | 40 | 2–5 |
| Club Player | 1300–1600 | 8–25% | 32 | 4–8 |
| Advanced | 1600–1900 | 25–50% | 24 | 6–12 |
| Elite | 1900–2300 | 50–85% | 16 | 10–20 |
| National Level | 2300–2600 | 85–97% | 16 | 15–25 |
| World-Class | 2600+ | > 97% | 10–16 | 25+ |
🏓 ITTF Table Tennis Table Dimensions
| Spec | Imperial | Metric | Standard |
|---|---|---|---|
| Table Length | 108 in | 274 cm | ITTF Regulation |
| Table Width | 60 in | 152.5 cm | ITTF Regulation |
| Table Height | 30 in | 76 cm | ITTF Regulation |
| Net Height | 6 in | 15.25 cm | ITTF Regulation |
| Net Width | 72 in | 183 cm | ITTF Regulation |
| Ball Diameter | 1.57 in | 40 mm | ITTF 2015+ |
| Min. Play Area (L) | 336 in | 854 cm | Tournament min. |
| Min. Play Area (W) | 168 in | 427 cm | Tournament min. |
🏋 Expected Score vs. Rating Difference
| Rating Difference | Expected Score (Higher) | Win Probability | Points Gained if Win |
|---|---|---|---|
| 0 (Equal) | 0.500 | 50.0% | K × 0.5 |
| +50 | 0.571 | 57.1% | K × 0.429 |
| +100 | 0.640 | 64.0% | K × 0.360 |
| +150 | 0.702 | 70.2% | K × 0.298 |
| +200 | 0.760 | 76.0% | K × 0.240 |
| +300 | 0.849 | 84.9% | K × 0.151 |
| +400 | 0.909 | 90.9% | K × 0.091 |
| +600 | 0.975 | 97.5% | K × 0.025 |
📋 Common Tournament Formats
| Format | Games Format | Typical Players | Avg Match Duration |
|---|---|---|---|
| Best of 5 (Bo5) | First to 3 games | Club & Regional | 20–40 min |
| Best of 7 (Bo7) | First to 4 games | National & Elite | 35–60 min |
| Round Robin | Bo5 per match | 4–8 per group | 2–4 hrs total |
| Single Elimination | Bo5 or Bo7 | 8–128 draw | 3–8 hrs event |
| Double Elimination | Bo5 standard | 8–64 draw | 4–10 hrs event |
| Team Event (3v3) | Bo5 each | 2 teams of 3 | 1.5–3 hrs |
💡 Elo Formula: New Rating = Current Rating + K × (Actual Score – Expected Score). Expected Score = 1 / (1 + 10^((Opponent Rating – Your Rating) / 400)). A win scores 1, loss scores 0, draw scores 0.5.
🎯 K-Factor Guide: New players use K=40 for faster rating stabilization. After 30+ rated matches, drop to K=32 (club) or K=24 (advanced). Elite players with 2300+ ratings typically use K=16 to prevent wild swings from single matches.
The rating for table tennis seem a bit terrible initially, but genuinely they are quite a lot easy cause when one understands how them operate. Every participant in official tournament receives assigned rating. It is simply number, that points the quality of some folk in the game.
The more highly the rating, the better the player.
How Table Tennis Ratings Work
In United States the American Association for table tennis (USATT) report about the rating. It created a system of ratings, in that each match during official tournaments receives value. The USATT counts them by means of precise math rules.
The data come from official tournaments and league games. Most of the tournament event is “valuing events“, what wants to say, that one must have rating under defined limit for even feed.
When folk participates his first official event, the starting rating is figured according to funny mode. It bases on the average between teh best victory and the worst loss from that tournament. So, if one beats very strong opponent, but also lost against a bit weaker, those two results determine the rating.
Player with rating around 1200 can feed directly in the open group during his first tournament thus receive his first rating.
The rating table of USATT for victories and defeats depend on the difference in ratings between the two players. It applies a curve function, where one axis points the grade of difference between the ratings, during the other goes from 0 until 1 for represent probability. The point is, that those estimates our like to those of chess ratings.
USATT rankings estimate the activities of players during the past 24 months in certain events of high level in official tournaments. They intend to be fair and based only on merits.
Even so, in other lands exist entirely different methods. For instance in Germany one uses TTR, what is abbreviation for rating of table tennis. It ranges from around 500 until about 2700.
Compare ratings between various lands? It is almost impossible, because the systems do not match. Until now did not happen lot for reach global unity regarding standards.
In the international level the ITTF issues world rankings weekly. European rankings also exist and one gets updates regularly. Moreover are Ratings Central, that claims to be the most accurate system for ratings and ranking in table tennis.
It bases on the Glicko-system with element called rate deviant feature. When the deviation passes 100, theplayer goes from the list.
Some systems are much more basic and community based. One from them, for club level, created Mike Labins with simple notion: one groups players in round-robin groups weekly according to their skill. Series of tournaments have his own spots, and they update the rankings after every event.
Ratings as 1400 is considered “average”, if one considers the whole range, included of casual players, that never will access official tournaments.
