
Cricket Bowling Average Calculator – Analyze Your Stats
🏏 Cricket Bowling Average Calculator
Calculate bowling average, economy rate, strike rate & performance rating for any format
⚡ Quick Presets
📋 Bowling Statistics Input
📊 Bowling Performance Analysis
🎯 Key Bowling Stats Snapshot
10.75
World Record Avg (GA Lohmann)
6
Balls Per Over
<25
Elite Test Average
<3.0
Elite Test Economy
800
Most Test Wickets (Murali)
<40
Elite Test Strike Rate
563
Most ODI Wickets (Murali)
<7.0
Elite T20 Economy
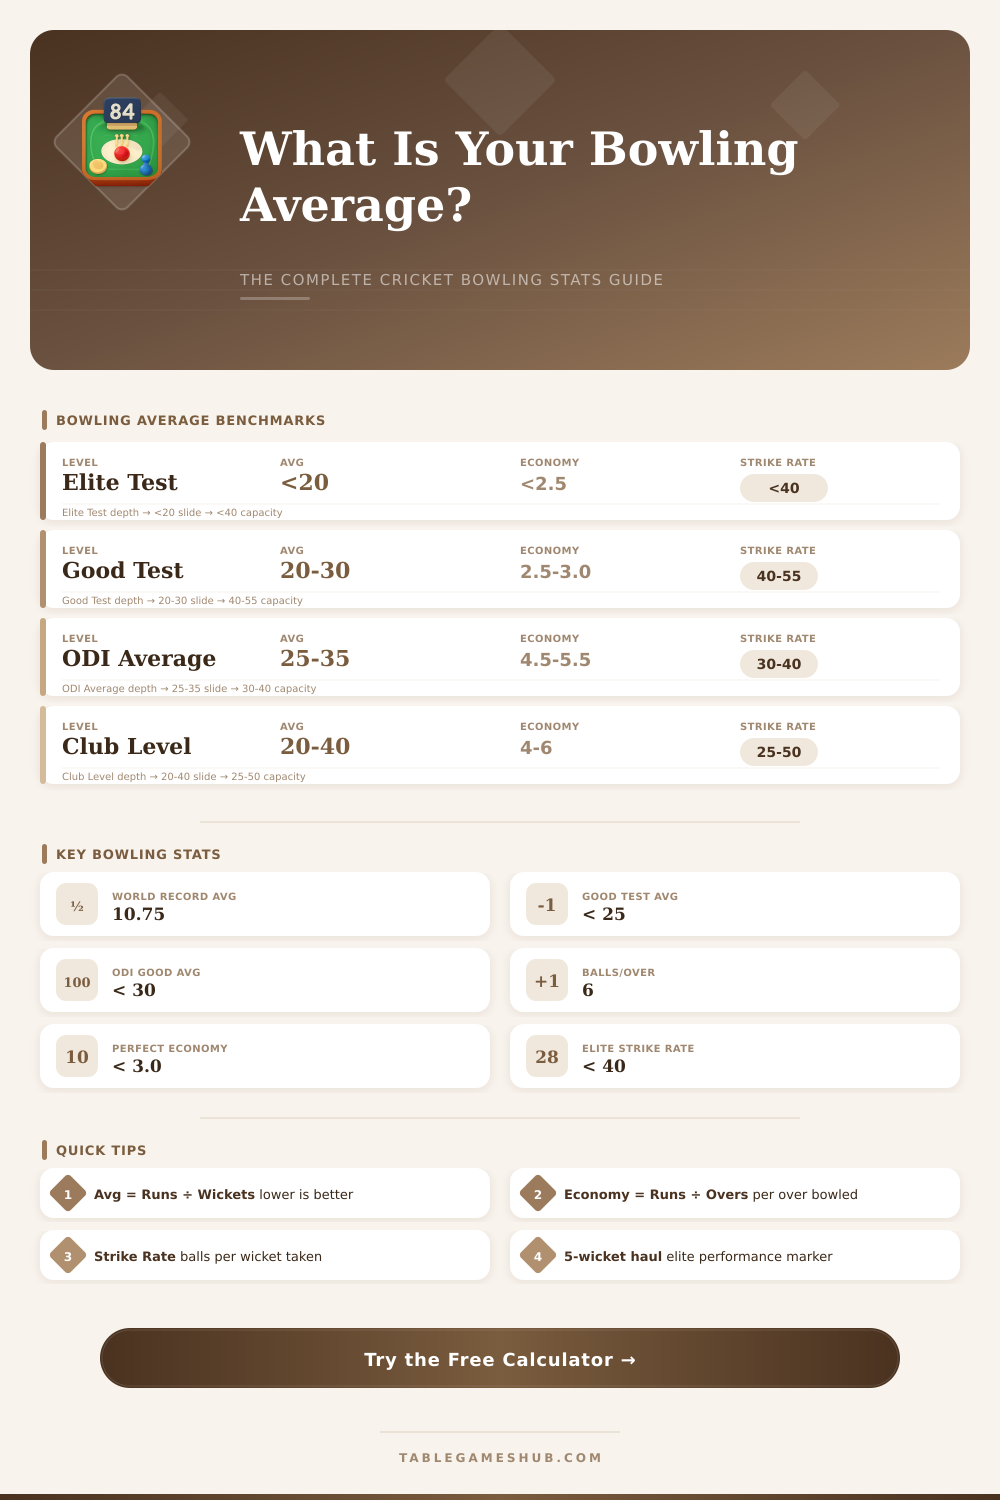
📐 Bowling Average Benchmarks by Format
| Performance Level | Test Average | ODI Average | T20 Average | Economy (T20) |
|---|---|---|---|---|
| World Class | < 20 | < 22 | < 18 | < 6.5 |
| Excellent | 20 – 25 | 22 – 28 | 18 – 22 | 6.5 – 7.0 |
| Good | 25 – 30 | 28 – 33 | 22 – 28 | 7.0 – 7.5 |
| Average | 30 – 38 | 33 – 40 | 28 – 35 | 7.5 – 8.5 |
| Below Average | 38 – 50 | 40 – 50 | 35 – 45 | 8.5 – 10 |
| Club / Developing | > 50 | > 50 | > 45 | > 10 |
🏋 Format-Specific Strike Rate Benchmarks
| Format | Elite Strike Rate | Good Strike Rate | Average Strike Rate | Max Overs/Match |
|---|---|---|---|---|
| Test Cricket | < 40 | 40 – 55 | 55 – 70 | Unlimited |
| First-Class | < 42 | 42 – 58 | 58 – 72 | Unlimited |
| ODI (50-over) | < 28 | 28 – 38 | 38 – 50 | 10 overs |
| T20 | < 14 | 14 – 18 | 18 – 24 | 4 overs |
| T10 | < 8 | 8 – 12 | 12 – 16 | 2 overs |
| Club Cricket | < 30 | 30 – 45 | 45 – 60 | Varies |
📜 All-Time Great Bowling Averages
| Bowler | Wickets | Average | Strike Rate | Economy |
|---|---|---|---|---|
| GA Lohmann (ENG) | 112 | 10.75 | 34.1 | 1.89 |
| SF Barnes (ENG) | 189 | 16.43 | 41.7 | 2.36 |
| M Muralitharan (SL) | 800 | 22.72 | 55.0 | 2.47 |
| SK Warne (AUS) | 708 | 25.41 | 57.4 | 2.65 |
| Glenn McGrath (AUS) | 563 | 21.64 | 51.9 | 2.49 |
| Wasim Akram (PAK) | 414 | 23.62 | 54.6 | 2.59 |
| Anderson (ENG) | 700+ | 26.45 | 56.7 | 2.80 |
| Anil Kumble (IND) | 619 | 29.65 | 65.9 | 2.69 |
💡 Calculation Tips
📐 Bowling Average Formula: Bowling Average = Total Runs Conceded ÷ Total Wickets Taken. A lower average is always better — it means you take wickets cheaply. An average under 20 in Test cricket is considered world-class.
⏱ Economy Rate & Strike Rate: Economy Rate = Runs Conceded ÷ Overs Bowled (runs per over). Strike Rate = Balls Bowled ÷ Wickets Taken (balls per wicket). Together with bowling average, these three stats give a complete picture of a bowler's effectiveness. In T20 cricket, economy rate is arguably the most important of the three.
The bowling mean in cricket shows how good bowlers are. One counts it by sharing the whole number of runs that he allowed, by the amount of wickets that he took. So, think about a bowler that gave up a lot of runs, but only few wickets; then the mean will appear quite bad.
Here you want the lowest values, rather than the batting mean.
Understanding Bowling Average in Cricket
Even so here is the key: the bowling mean and the economy rate is not the same thing. The economy rate stays simple… It simply points how many runs one allows for one over.
What about the bowling mean? It measures the runs given up for each taken wicket. Both look at entirely other parts of the bowling work.
For a good bowling mean at fast bowlers, one aims for values under 25. Under 22 that already is great, and most impressive on that hard ground in the Indian subcontinent, where the fast bowling gets little support. In the highest levels of cricket, keeping an under-25 mean during the whole career places you between the truly big of all times.
Many of the current top bowlers managed to stay under that limit during long periods.
We share some real figures to show that. Arshdeep Singh in one tournament took eight wickets in six matches and ended with a bowling mean of 21.37, his economy rate was 7.77. Another example is Lungi Ngidi, that seized 90 wickets in 63 T20I-matches.
His mean sits around 20.48, with economy of 8.59. Zaheer Khan during his 303 international matches for India took 597 wickets with a mean of 31.48. He also had some amazing showings (his best were 7 for 87), together with 12 five-wickets and 23 four-wickets during the career.
Between bowlers and batters sometimes appears a funny comparison. McGrath, probably the best average bowler in modern cricket, has a record almost equal to that of Sangakkara the best average batter. The bowling match to @Don Bradman would be around 12.38.
Most of the all-rounders end much more near the typical bowler than to the average batters.
Here is the reason: many cricket fans think that the sport should not depend only on means and strike rates, those numbers commonly miss a lot of context. A weak batting team can truly hurt the stats of a bowler. The strike rate matters a lot.
A bowler that took a wicket every 50 balls while he allows 3.5 runs per over, probably will have a mean around 30. But a disciplined bowler with precise line and length, that strikes every 60-plus balls with economy of around 2.5, can end with a much lower mean. In Test cricket especially, the strike rate gets more attention then the mean, when one compares the truly big.
Actually, the main task of the defending team is to limit the runs of the batting side, andbowlers are clearly central for that.
