
Chess Performance Rating Calculator – Find Your Elo Rating
♞ Chess Performance Rating Calculator
Calculate your Elo performance rating, expected score, and rating change from tournament results
⚡ Quick Presets
⚙ Calculator Settings
♟ Game Results (Enter Each Game)
| # | Opponent Rating | Result | Color | Remove |
|---|
📊 Your Chess Rating Analysis
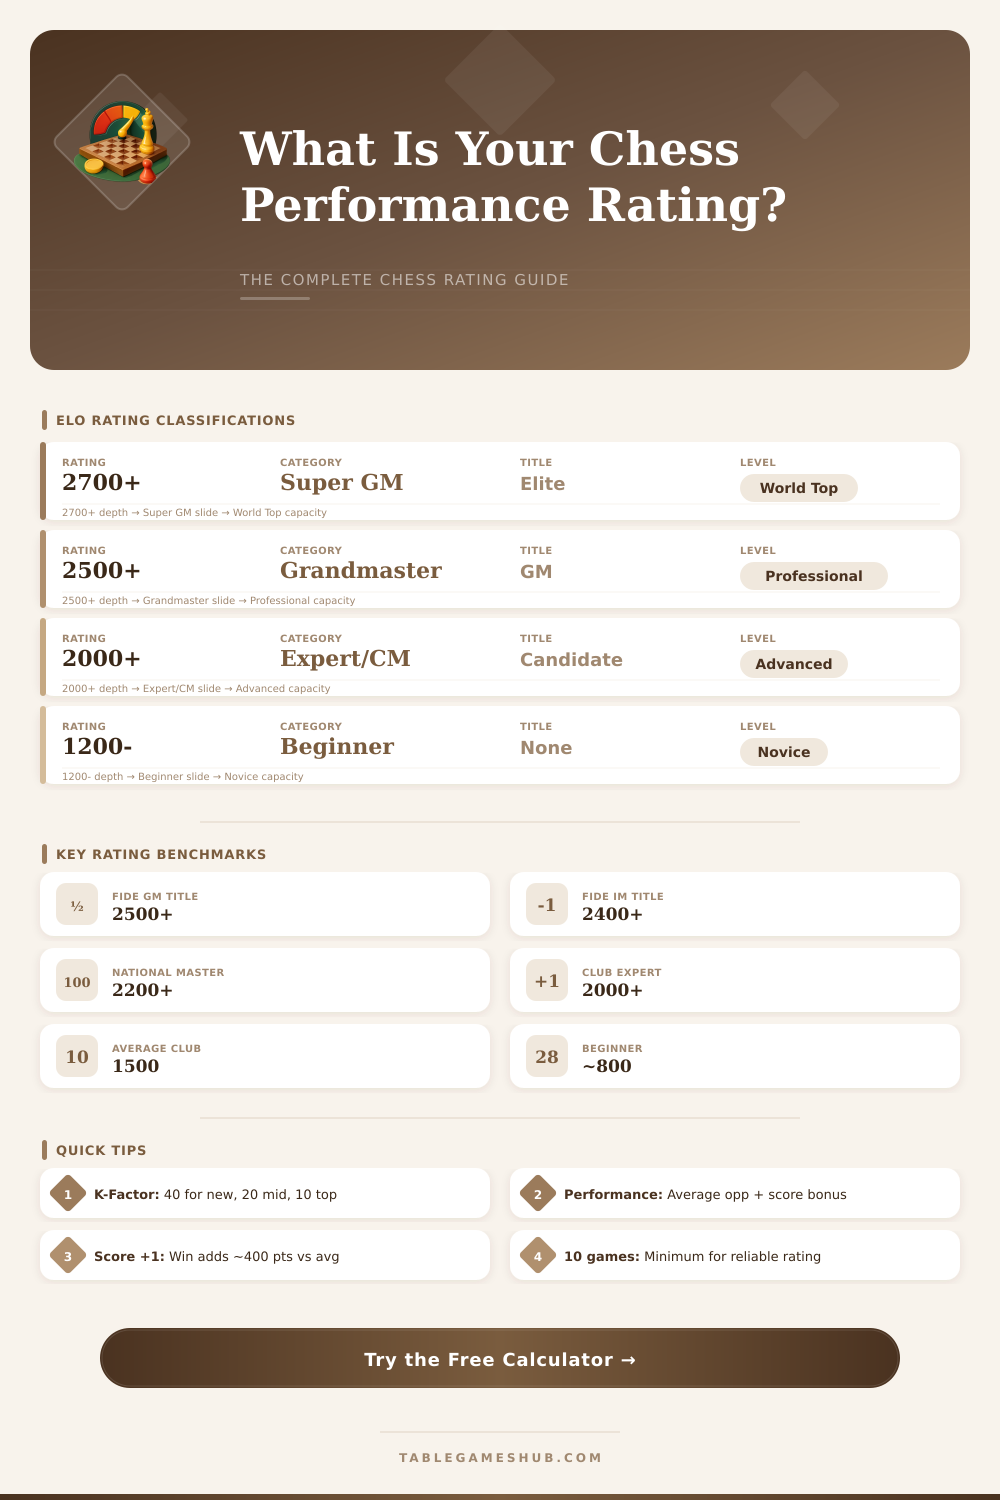
📊 Key Rating Benchmarks
800
Absolute Beginner
1200
Casual Player
1500
Average Club Player
1800
Strong Club Player
2000
Expert / Candidate
2200
National Master
2500
FIDE Grandmaster
2800+
World Elite
🏆 Elo Rating Classification Table
| Rating Range | Category | FIDE Title | Win Probability vs 1500 | Typical Games/Year |
|---|---|---|---|---|
| Below 1000 | Beginner | None | 3% | 20-50 |
| 1000 – 1199 | Novice | None | 9% | 30-60 |
| 1200 – 1399 | Intermediate | None | 24% | 40-80 |
| 1400 – 1599 | Average | None | 43% | 40-100 |
| 1600 – 1799 | Advanced | None | 64% | 50-120 |
| 1800 – 1999 | Strong Club | None | 76% | 60-150 |
| 2000 – 2199 | Expert | Candidate Master | 85% | 80-200 |
| 2200 – 2299 | National Master | FIDE Master | 91% | 80-200 |
| 2300 – 2399 | International Level | IM (candidate) | 95% | 100-250 |
| 2400 – 2499 | International Master | IM | 97% | 100-300 |
| 2500 – 2599 | Grandmaster | GM | 99% | 100-350 |
| 2700+ | Super Grandmaster | GM (Elite) | 99.9% | 100-400 |
📈 Elo Expected Score Table (Rating Difference)
| Rating Difference | Expected Score (Higher) | Expected Score (Lower) | Win % | Draw % |
|---|---|---|---|---|
| 0 (Equal) | 0.50 | 0.50 | 38% | 24% |
| 50 pts | 0.57 | 0.43 | 44% | 26% |
| 100 pts | 0.64 | 0.36 | 50% | 28% |
| 150 pts | 0.70 | 0.30 | 55% | 30% |
| 200 pts | 0.76 | 0.24 | 60% | 32% |
| 300 pts | 0.85 | 0.15 | 70% | 30% |
| 400 pts | 0.91 | 0.09 | 78% | 26% |
| 500 pts | 0.95 | 0.05 | 85% | 20% |
| 735+ pts | 1.00 | 0.00 | 99%+ | <2% |
⚙ K-Factor Reference Guide
| K-Factor | System | Applies To | Max Rating Change/Game | Notes |
|---|---|---|---|---|
| 40 | FIDE | New players (first 30 games or under 1000) | 40 pts | Fastest rating change period |
| 20 | FIDE | Players below 2400 (established) | 20 pts | Standard for most rated players |
| 10 | FIDE | Players rated 2400+ at any time | 10 pts | Reduced volatility for top players |
| 32 | USCF | All players (basic) | 32 pts | Higher than FIDE standard |
| 24 | USCF | Rated below 2100 | 24 pts | Mid-range USCF |
| 16 | USCF | Rated 2100 or above | 16 pts | Stable for strong USCF players |
🥇 Title Norm Performance Requirements
| Title | Min Performance Rating | Min Score % | Norms Needed | Min Games/Norm |
|---|---|---|---|---|
| FIDE Master (FM) | 2300 | — | Rating only | — |
| Candidate Master (CM) | 2200 | — | Rating only | — |
| International Master (IM) | 2450 | ~56% | 3 norms | 9 |
| Grandmaster (GM) | 2600 | ~56% | 3 norms | 9 |
| Woman FM (WFM) | 2100 | — | Rating only | — |
| Woman GM (WGM) | 2300 | ~56% | 3 norms | 9 |
💡 Performance Rating Formula: Your performance rating equals the average opponent rating plus an adjustment based on your score percentage. Scoring 50% gives the average opponent rating; each extra 25% adds roughly 200 Elo points. For a perfect score (+1 point per game), add up to 800 to the average opponent rating.
⚡ Rating Change Tip: The K-factor controls how fast your rating changes. New players use K=40 so ratings establish quickly. Once established, K=20 is standard. For a win against an equal opponent (expected score = 0.5), you gain K × 0.5 = 10 points (with K=20). Beating a much higher-rated player gains nearly the full K value.
Performance Rating in Chess simply shows how well some player performs during a particular tournament or match. It is calculated from three main elements: the number of games that they played, their total score and the Elo ranks of the opponents that they met. Think about it like this: it is the Elo rank that a player would deserve, if his results in that event would match his real skill.
Assume that some player plays his first tournament and ends with a 1500 rank. That 1500 is also his Performance Rating for that tournament.
What Chess Performance Rating Means
Counting performance for one game is fairly easy. If you beat an opponent with, say, an 1800 rank, your performance for that game comes to 1800 plus 400. If you lose against the same player, it drops to 1800 minus 400.
A draw against them leaves you at their rank, 1800. When you have all those separate game performances the whole for the tournament is simply the average of everything together.
FIDE uses a bit different method. They average all ranks of the opponents first, then add or remove a change in points based on the number of wins or losses that you reached. There is also the “400-rule” formula…
It is very simple. One adds the ranks of every opponent, includes 400 times the differnce between your wins and losses, and then divides the total by the number of games. For instance, a player that met five opponents twice each, ended with a Performance Rating of 2830 using exactly this method.
Perfect results are handled differently. If someone plays without faults against an opponent, the formula adjusts: one takes the average rank of the opponent and adds 800. Winning 2-0 against a player of 2750?
It gives a performance of 3550. It sounds exciting, of coarse. That simply happens in the math when you do not lose even one game.
But here is what causes problems. Reaching a high performance over many games is much harder than doing it in only a few. A player could beat two low-ranked opponents and end with a big number that does not truly reflect his real skill.
So critics commonly suggest a minimum number of games, so that Performance Ratings truly have meaning. Around 20 games yearly is considered a good limit for serious professionals.
The original Elo theory is based on the idea that the performance of a Chess player in every game follows a normal distribution. Someone could play great one day and much weaker the next, but his real strength adjusts only slowly over time. The main conclusion?
Performance Ratings shift only a little. Most players experience swings between 100 and 200 points from one event to the next. The recordperformance always reached past 3000, with one extreme at 3098 from the Sinquefield Cup in 2014.
