Risk Board Game Odds Calculator: Attack & Defense Probabilities
🎲 Risk Board Game Odds Calculator
Calculate attack vs. defense probabilities for any Risk battle scenario with full dice breakdown
⚡ Quick Battle Presets
⚙️ Battle Configuration
📊 Battle Analysis Results
🎮 Risk Game Components at a Glance
42
Territories
6
Continents
5
Dice Total
40
Armies / Player
44
Territory Cards
2
Wild Cards
6
Max Players
120+
Min. Total Armies
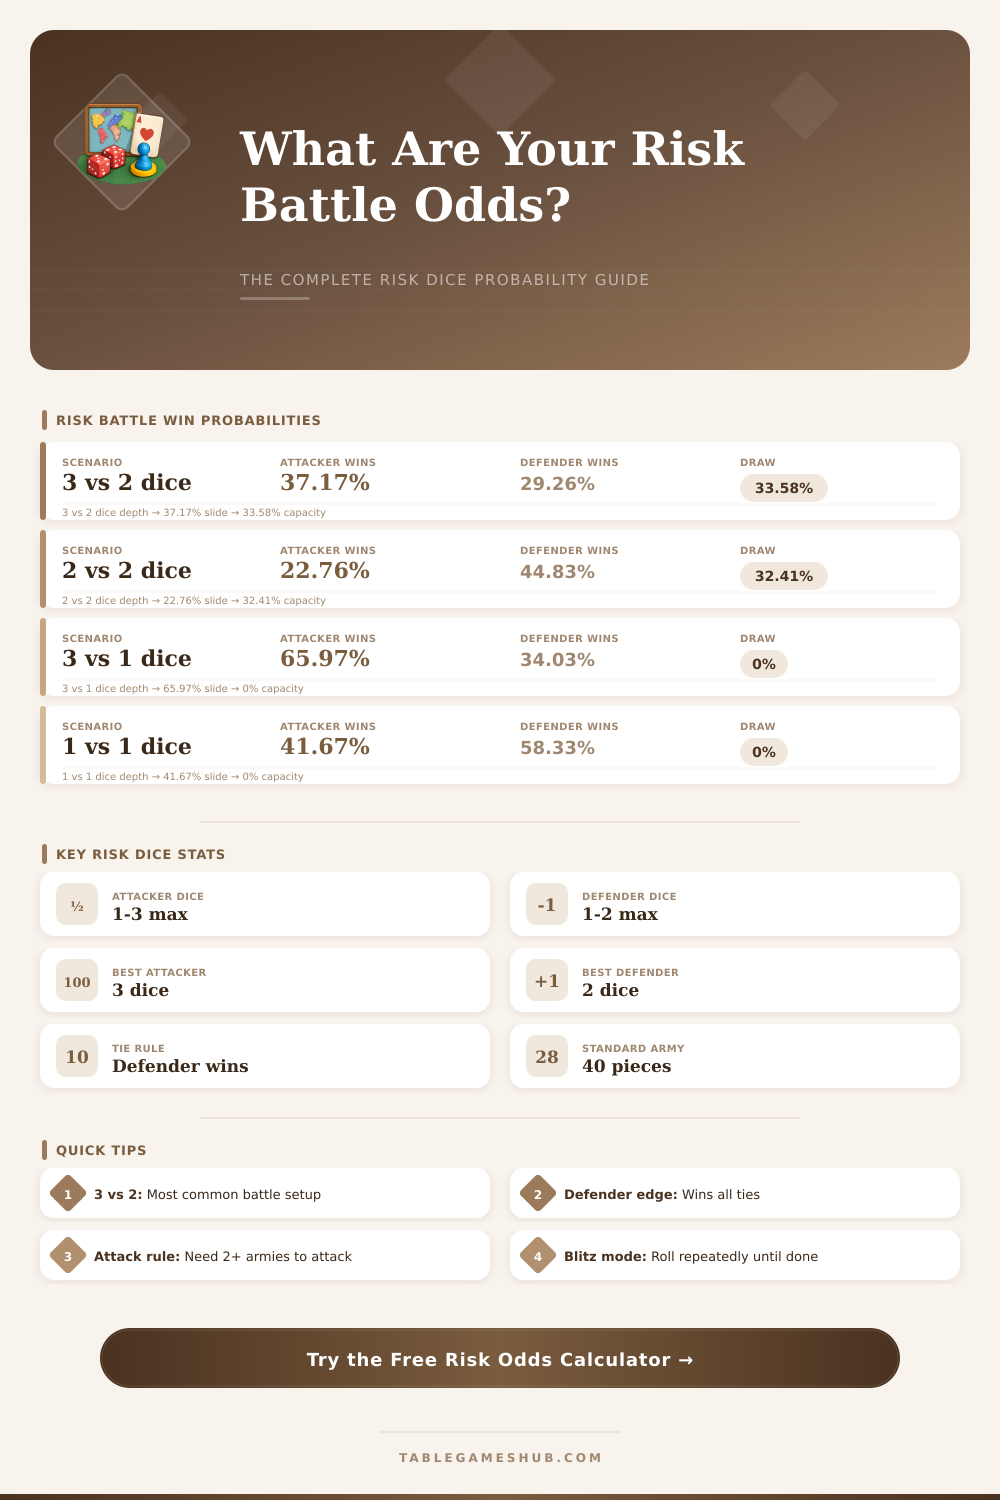
🎲 Risk Battle Probability Reference Table
| Dice Matchup | Attacker Wins All | Defender Wins All | Split Result | Expected Att. Loss |
|---|---|---|---|---|
| 3 Att vs 2 Def | 37.17% | 29.26% | 33.58% | 0.921 armies |
| 2 Att vs 2 Def | 22.76% | 44.83% | 32.41% | 1.224 armies |
| 1 Att vs 2 Def | 25.46% | 74.54% | N/A | 0.745 armies |
| 3 Att vs 1 Def | 65.97% | 34.03% | N/A | 0.340 armies |
| 2 Att vs 1 Def | 57.87% | 42.13% | N/A | 0.421 armies |
| 1 Att vs 1 Def | 41.67% | 58.33% | N/A | 0.583 armies |
📈 Blitz Campaign Win Probability (3 vs 2 Dice)
| Attackers | Defenders | Attacker Win % | Defender Win % | Avg. Survivors |
|---|---|---|---|---|
| 3 | 1 | 96.2% | 3.8% | 2.1 att. |
| 3 | 2 | 78.8% | 21.2% | 1.6 att. |
| 5 | 3 | 79.9% | 20.1% | 2.4 att. |
| 5 | 5 | 53.9% | 46.1% | 1.3 att. |
| 10 | 5 | 88.2% | 11.8% | 5.3 att. |
| 10 | 10 | 52.9% | 47.1% | 1.5 att. |
| 20 | 10 | 90.5% | 9.5% | 9.8 att. |
| 15 | 8 | 89.1% | 10.9% | 7.1 att. |
🌍 Risk Continent Reinforcement Bonuses
| Continent | Territories | Bonus Armies | Strategic Value |
|---|---|---|---|
| Australia | 4 | +2 | ⭐⭐⭐⭐⭐ Highest |
| South America | 4 | +2 | ⭐⭐⭐⭐ Very High |
| Africa | 6 | +3 | ⭐⭐⭐ Medium |
| North America | 9 | +5 | ⭐⭐⭐⭐ High |
| Europe | 7 | +5 | ⭐⭐⭐ Medium |
| Asia | 12 | +7 | ⭐⭐ Hardest |
🃏 Risk Card Set Trade-In Values
| Trade # | Card Set Required | Armies Received | Notes |
|---|---|---|---|
| 1st | 3 Infantry or mixed | 4 | First trade value |
| 2nd | 3 Cavalry or mixed | 6 | Second trade |
| 3rd | 3 Artillery or mixed | 8 | Third trade |
| 4th | Any valid set | 10 | Fourth trade |
| 5th | Any valid set | 12 | Fifth trade |
| 6th | Any valid set | 15 | Sixth trade |
| 7th+ | Any valid set | +5 each | Escalating |
💡 Attacker Advantage Tip: Rolling 3 dice vs 2 gives the attacker a 37.17% chance to win both losses vs the defender's 29.26%. Always roll max dice when possible — the odds favor an aggressive 3-die attack over all other combinations.
🛡️ Defender Tie Rule: In Risk, ties always go to the defender. This is why even a 3 vs 1 matchup only gives the attacker a ~66% win rate. When defending, 2 dice significantly outperform 1 die — always use 2 dice if you have 2+ armies.
Probability and Risk; those words always appear in medical papers, game strategies and guides, but one uses them so freely that most folks believe that they are the same thing. That is not entirely true. Both ideas try to estimate how far something will probably happen, but they approach the topic by means of entirely different methods.
In solid scientific surveys and in epidemiology one counts probabilities from the number of folks that had a certain result, divided by those that did not. Risk works otherwise, because it considers what share from the whole group gets the result. The main difference lies in the bottom number.
Difference Between Probability and Risk
Usually probabilities one writes as a ratio for instance 1:4, while Risk one shows as a percentage, say 10 percent. So two different ways to estimate the same main question.
One can express probabilities as a ratio between two whole numbers, what sometimes eases their use in various situations. Assume that you have a probability of 0.01, that matches to 1:100. A probability of 0.33 becomes 1:3, and 3 turns into 3:1.
In gambling, probabilities point your possible prizes against your investments. Medicine takes a similar structure, but applies it to the ratio between folks that experienced the event, and those that did not. Really, one can convert probabilities into Risk and the otehr way around, although that requires precise math rules that commonly make the brain twist.
The report about probability compares the likelihood of something in one group to another group. Case-control studies commonly depend on that measure. Relative Risk follows another way and more commonly appears in group surveys, it estimates your Risk for a result, if you are exposed to something, against if you are knot.
Here is an interesting spot: for rare cases, where the numbers of affected stay small compared to the whole population, probability and Risk actually match almost perfectly. So probability reports sometimes serve as a good guess for relative Risk, when one studies rare diseases.
Some folks feel that relative Risk is more natural to understand than probability reports. However probability reports have their strength, they stay stable as a rating of impact, regardless of the base value. Relative Risk, on the other hand, adjusts according to other elements in the game.
Now we turn to dice games. When attackers roll three dice against two defenders, the probabilities almost match. The attacker has a bit of advantage, but it fades soon, when chance enters itself.
Roll two dice? Then the attacker beats around 37 percent of times, the defender 34 percent, and 29 percent end in a tie, where both lose a soldier. If 20 armies attack 10, the attacker has almost 97 percent chance to win.
To reach almost equal 50-50 chance, you need around 1.7 times more defending armies. If you double the defenders… Say six against three, the probabilities slide to around 60 percent in their favour.
The defenderbestrolls two dice, when it is possible, to limit the losses.
