🎲 Dice Probability Calculator
Calculate exact probabilities for any dice combination, target sum, or outcome scenario
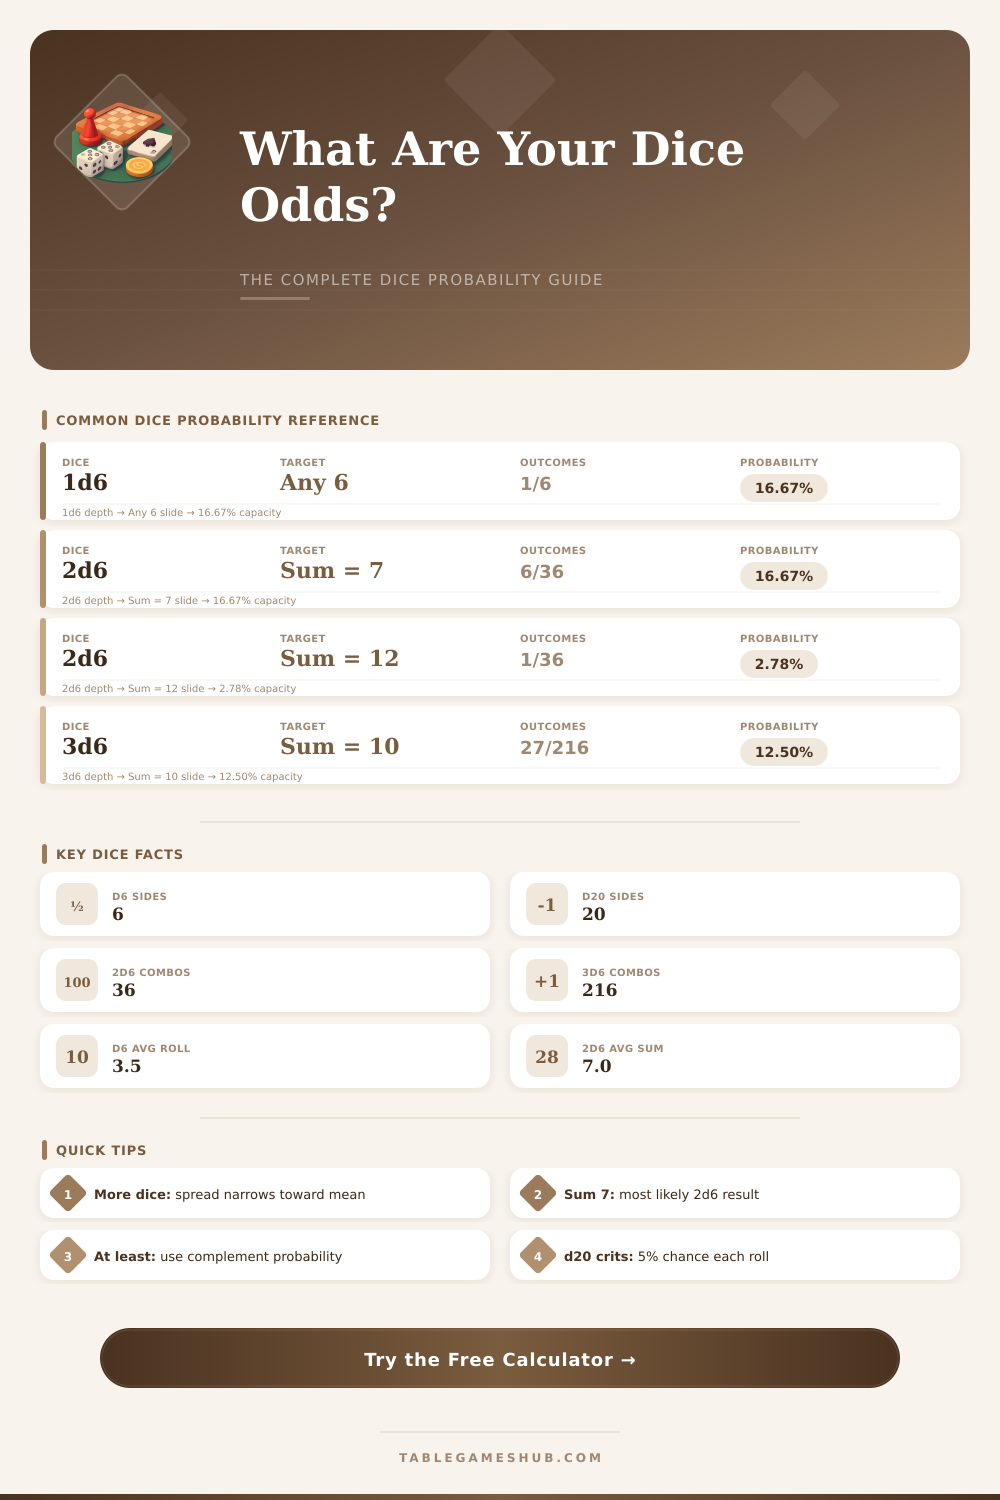
| Sum | Combinations | Probability | Cumulative (At Least) |
|---|---|---|---|
| 2 | 1 of 36 | 2.78% | 100% |
| 3 | 2 of 36 | 5.56% | 97.22% |
| 4 | 3 of 36 | 8.33% | 91.67% |
| 5 | 4 of 36 | 11.11% | 83.33% |
| 6 | 5 of 36 | 13.89% | 72.22% |
| 7 | 6 of 36 | 16.67% | 58.33% |
| 8 | 5 of 36 | 13.89% | 41.67% |
| 9 | 4 of 36 | 11.11% | 27.78% |
| 10 | 3 of 36 | 8.33% | 16.67% |
| 11 | 2 of 36 | 5.56% | 8.33% |
| 12 | 1 of 36 | 2.78% | 2.78% |
| Dice Type | Min | Max | Average Roll | Single Face % | Common Use |
|---|---|---|---|---|---|
| d4 | 1 | 4 | 2.5 | 25.00% | Damage (dagger, magic missile) |
| d6 | 1 | 6 | 3.5 | 16.67% | Standard games, Yahtzee, Craps |
| d8 | 1 | 8 | 4.5 | 12.50% | D&D weapon damage |
| d10 | 1 | 10 | 5.5 | 10.00% | Percentile rolls, World of Darkness |
| d12 | 1 | 12 | 6.5 | 8.33% | Warhammer, barbarian hit die |
| d20 | 1 | 20 | 10.5 | 5.00% | D&D attack rolls, skill checks |
| d100 | 1 | 100 | 50.5 | 1.00% | Percentile tables, Call of Cthulhu |
| Game | Dice Used | Key Roll | Probability | Players |
|---|---|---|---|---|
| Craps (Pass Line) | 2d6 | 7 or 11 on come-out | 22.22% | 2–20 |
| Monopoly | 2d6 | Doubles (any) | 16.67% | 2–8 |
| Yahtzee | 5d6 | Five of a kind | 0.08% | 1–6 |
| D&D Attack (d20) | 1d20 | Natural 20 (critical) | 5.00% | 1+ |
| Risk (attack 3d6) | 3d6 vs 2d6 | Attacker wins all | ~37.17% | 2–6 |
| Backgammon | 2d6 | Specific doublet | 2.78% | 2 |
| Farkle | 6d6 | No scoring dice (farkle) | ~2.31% | 2–8 |
| Liar's Dice | 5d6 per player | Specific value on one die | 16.67% | 2–6 |
| Single Roll % | 2 Rolls | 3 Rolls | 5 Rolls | 10 Rolls | 20 Rolls |
|---|---|---|---|---|---|
| 5% (d20 nat 20) | 9.75% | 14.26% | 22.62% | 40.13% | 64.15% |
| 8.33% (d12 spec.) | 16.03% | 23.22% | 35.95% | 58.27% | 82.89% |
| 16.67% (d6 spec.) | 30.56% | 42.13% | 59.81% | 83.85% | 97.35% |
| 25% (d4 spec.) | 43.75% | 57.81% | 76.27% | 94.37% | 99.68% |
| 50% (coin flip) | 75.00% | 87.50% | 96.88% | 99.90% | ~100% |
dice seem simple at first sight, but below lies solid math. Consider the sample spaces as all possible results that can happen. For dice that means that we must enter every physically possible result.
When we chart those possibilities, probability truly makes sense.
How Dice Probabilities Work
Roll one cube and the calculations stay very easy. It has six possible sides, and if we assume that the cube is not weighted, every side is equally probable. So you have one in six chances for any certain number, or around 17 percent if you think in that way.
Assume that you want to roll 1, 2 or 6. Then simply add the separate probabilities: one sixth plus one sixth plus one sixth, which makes three sixths or simply half.
Two dice? Right here starts the fun part. There appear 36 various combinations that you can reach.
Add the two results for the total amount, and the probabilities move in unusual directions. The amount 2 or 12 happen only one time from 36. For 3 or 11 it doubles to two from 36.
Keep going: 4 or 10 come three times from 36, then 5 or 9 four tiems, and 6 or 8 five times. But here the surprise, 7 appears six times from 36. So 7 is the amount that most commonly comes.
Roll one cube and you get perfectly equal distribution, each number has same chance. But when you roll several dice and add them, the chart changes a lot. Extreme values disappear almost, while centers mass.
One cube forms a straight line. Two dice create a shape similar too a pyramid. With three or more?
Here we see the typical curved form, where everything focuses centrally.
More dice make average rolls much more probable, while extreme results become truly rare. Most games do not force you to reach exactly one number. On the contrary, players commonly must beat a certain value or reach it or bigger, depending on the target.
That difference is important when one designs games.
Online calculators for dice help exactly with those cases. Many of them are made for tabletop games and work with various kinds of cubes, four-sided, twenty-sided, whatever you need. They show the chances to roll a certain number directly, or to beat or go below some limit.
Here is a clever code called the complete rule, to estimate whether something will happen at least one time through several rolls. Take the probability for one roll (call it p) and the chance for at least once in n rolls is one minus (one minus p) to the n’s power. When probability and play combine, it creates experiences thatfeel fair and fun.